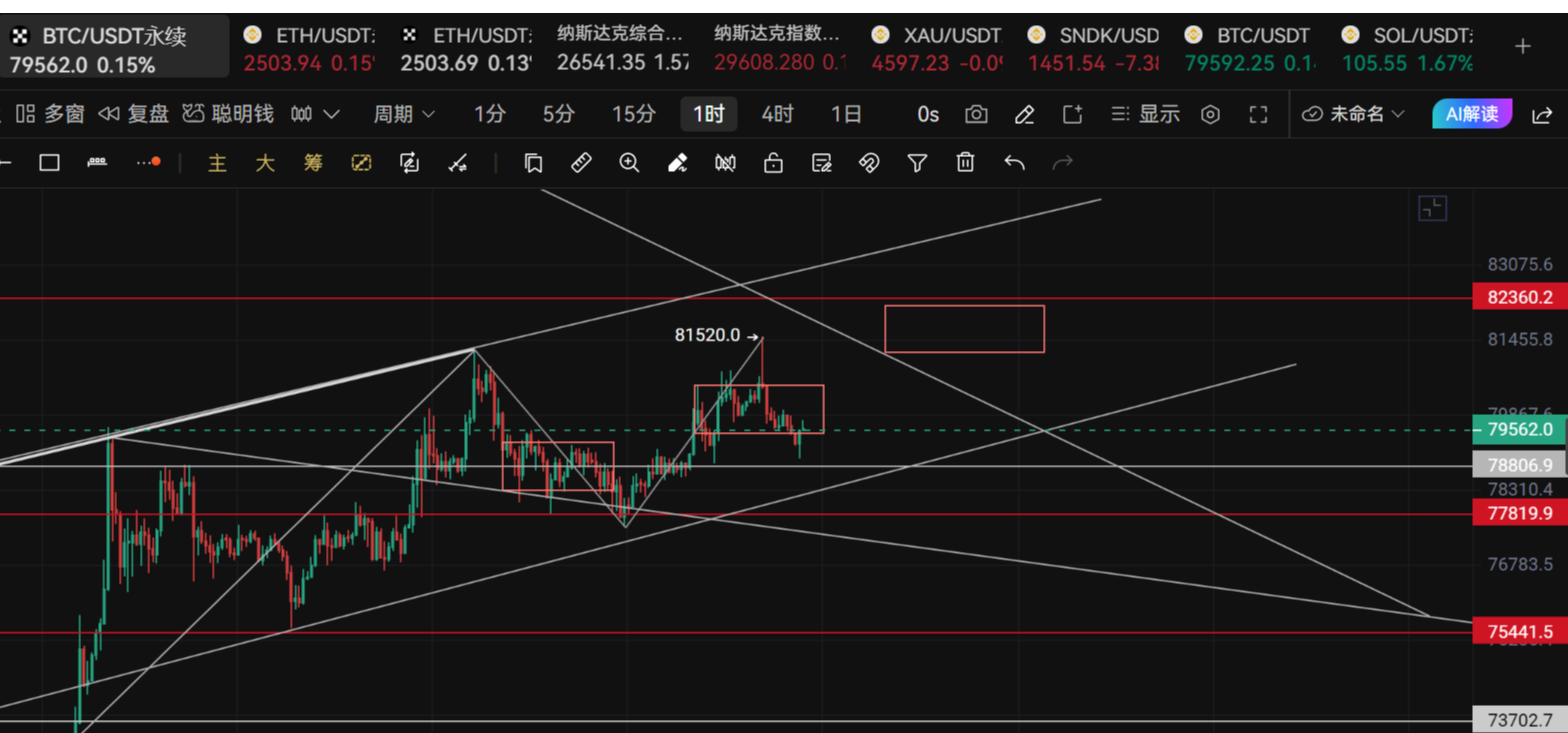
Crypto Circle Academy: The trend of Ethereum (ETH) on August 29 is not yet over, but the risk of a pullback has quietly accumulated? Latest market analysis reference
The current price of Ethereum is 2490. After seeing the price soar, it has begun to fluctuate at a high level, causing many people to feel conflicted. Those chasing high prices fear getting trapped, while those shorting are worried the market will continue to break upward. Those holding positions are anxious, and those with no positions fear missing out on the next rise. There is now a significant divergence in the market between bulls and bears. After a sharp rise, there has been no clear trend, and the repeated fluctuations at a high level will confuse many people's mindsets. Do not blindly open positions based on feelings, and do not impulsively chase prices or sell after a big rise.
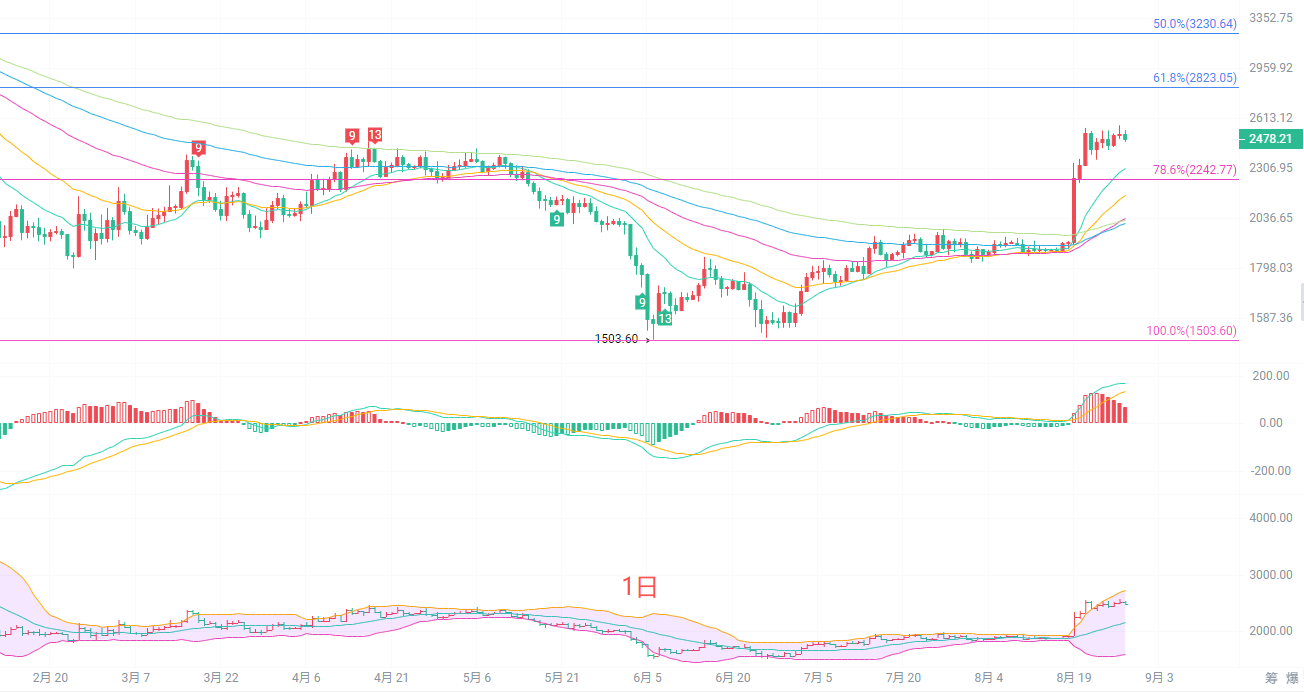
The daily K-line has already stood above all EMA moving averages, and the mid to long-term moving averages are turning upward, indicating that the bullish trend is not broken. The MACD indicator maintains red bars, and bullish momentum still exists, but the red bars are shrinking, with significant pressure at the important level of 3638 above. There is still considerable space before reaching that pressure level. The Bollinger Bands are opening upwards, with the price running near the upper band. After a continuous rise, signs of stagnation have appeared. The key support level is at 2242, the Fibonacci 78.6 position, which is an important defense level for this round of upward movement. As long as the daily K-line does not effectively break this position, the large-scale bullish trend continues; if the closing price falls below it, then a deep pullback risk should be warned.
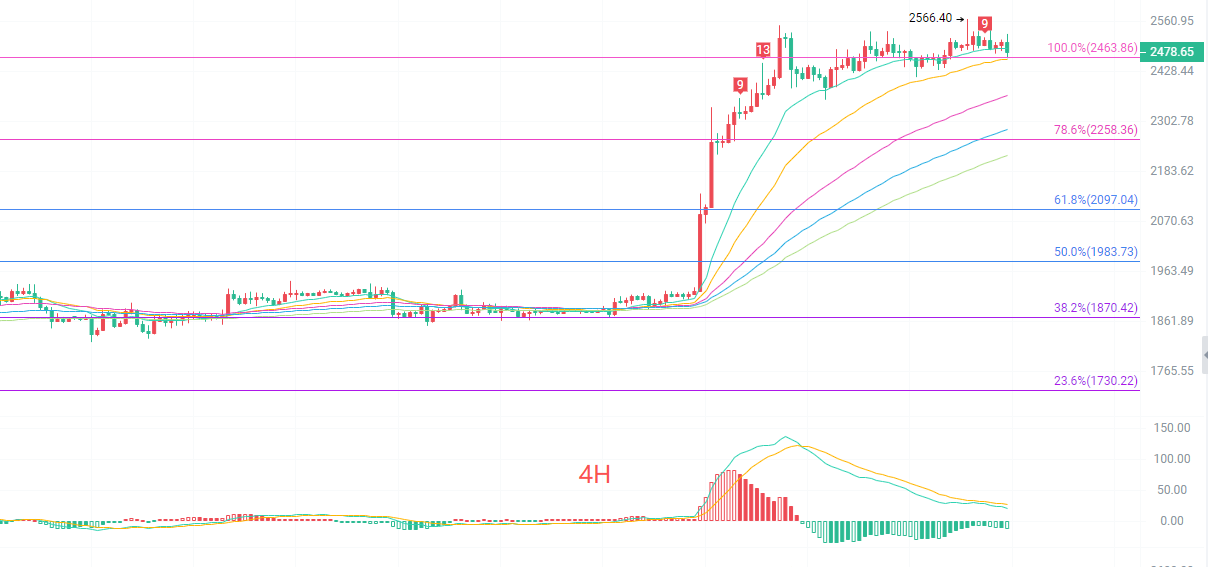
The four-hour K-line is steadily above the EMA short-term moving average, with the moving averages providing support in a bullish arrangement, but the MACD has shown signs of a top divergence, with red bars continuously shrinking, indicating that bullish strength is gradually weakening and that a pullback for correction is needed in the short term. The Bollinger Bands are slightly narrowing, with the upper band at 2525 forming short-term pressure and the lower band at 2441 providing nearby support. The Fibonacci complete wave segment's 100% position is 2463, where the price is repeatedly contesting nearby. There are no clear reversal signals in the market, indicating it is in a consolidation phase after an increase. If it stabilizes above the high point of 2566, it will open new upward space; if it continues to face pressure, it is likely to test the support range of 2441-2436.
Short-term reference:
If the lower range of 2470 to 2450 does not break downward, stop loss at 40 points, targeting 2560 to 2620.
If the upper range of 2590 to 2610 does not break upward, stop loss at 40 points, targeting 2550 to 2520.
Specific operations should be based on real-time market data. For more details, you can consult the author. The publication of the article may be delayed, and it is advised for reference only, with risks being borne by oneself.

Warm reminder: The above content is only created by the author of the public account. The advertisements at the end of the article and in the comments section are unrelated to the author. Please be cautious in your identification. Thank you for reading.
免责声明:本文章仅代表作者个人观点,不代表本平台的立场和观点。本文章仅供信息分享,不构成对任何人的任何投资建议。用户与作者之间的任何争议,与本平台无关。如网页中刊载的文章或图片涉及侵权,请提供相关的权利证明和身份证明发送邮件到support@aicoin.com,本平台相关工作人员将会进行核查。