
On July 20, 2026, the mobile application of the investment platform Fun Coffee suddenly ceased operations, leaving investors in Hong Kong and Macau unable to recover their principal or receive the promised returns. Multiple contacts with customer service went unanswered. The Hong Kong police, together with the Macau Judicial Police, later identified it as a scam group. As of August 19, a total of 286 reports had been received, involving a total amount of about 118 million Hong Kong dollars.

Image · Fun Coffee victims' rights protection (Image source: Sing Tao Daily)
This company claimed to be headquartered on Phu Quoc Island, Vietnam, engaged in the research and development of high-tech coffee equipment, coffee gene optimization technology, and intelligent irrigation and fertilization systems. It claimed total assets exceeding $1 billion and more than 5,000 employees. The investment plan disclosed by the Hong Kong police was divided into three tiers: Start, Growth, and Voyage, alleging annual returns of approximately 197% to 278%. For the highest tier, Voyage, for an investment of 29,800 USDT (about 230,000 Hong Kong dollars) held for 570 days, the platform claimed a profit of about 1 million Hong Kong dollars.
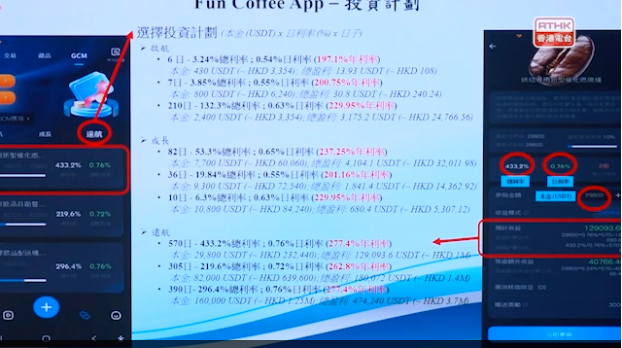
Image · Fun Coffee investment plan (Image source: Radio Television Hong Kong)
Our investigation starts from the transfer records of one of the victims. This network, composed of 99 addresses, cumulatively received 72,829,035 USDT from external sources, and by the time of this data cutoff, all had been transferred out, with the current USDT balance of the 99 addresses totaling only 1.52.
The background information about the case is cited from public disclosures by the Hong Kong Securities and Futures Commission, the Public Security Bureau of Phu Yen Province in Vietnam, and the police in Hong Kong and Macau, all of which have been cross-checked against original pages; the remaining data and conclusions stem from our independent analysis of on-chain records, covering only USDT flows on the TRON chain. The description of address functionality in the text is based on on-chain behavioral patterns and entity affiliation records in the BlockSec label database, and does not equate to the identity or legal responsibility of the holders. To protect the victims' privacy, this article does not display their wallet addresses, transaction hashes, or personal investment amounts.
Regulatory warnings occurred before platform shutdown
Before viewing any on-chain data, the chronological order of public information itself is worth noting. The Public Security Bureau of Phu Yen Province in Vietnam had issued a risk warning as early as May 15, 2026, indicating that the claimed returns of the model "typically range from 10% to 30% per month" and encouraged participants to recruit new members through a multi-tiered commission and team performance rewards system, recognizing the risks of disguised multi-level marketing and Ponzi schemes. The warning stated very plainly: these returns do not come from selling coffee but rely on the funds of later participants. On July 13, the Hong Kong Securities and Futures Commission included the "Fun Coffee GCM Project" in its list of suspicious investment products, categorized as other investments, and recorded both the operator and promoter as Fun Coffee (Hong Kong/Vietnam), indicating that regulatory authorities viewed the two locations as the same entity.
On July 20, the app stopped operating. The criminal investigation by the Hong Kong police was initiated only after reports began coming in in July after the shutdown. From August 1 to 3, the police in Hong Kong and Macau conducted a joint operation codenamed "Steadfast," arresting eight individuals, six of whom were charged with conspiracy to commit fraud, including company directors, shareholders, secretaries, and key members responsible for promoting the project and recruiting investors. The police managed to freeze about 610,000 Hong Kong dollars believed to be criminal proceeds.
The operational method of the platform itself is not complicated. Participants received extra bonuses for bringing in friends and family; the Vietnamese police pointed out that the seminar at the site taught how to recruit people to obtain system commissions and team performance rewards. Payments were conducted entirely via cryptocurrency. According to disclosures by the Hong Kong police, after investors downloaded the app and registered, customer service "would instruct them to transfer virtual currency to designated cryptocurrency wallets; only after completing the recharge could they invest on the platform." The model in Macau was slightly different; victims handed cash to store staff, who assisted them in completing the recharge, with investment funds eventually transferred to the upline's designated cryptocurrency accounts, while this upline was also responsible for allocating operating funds to the stores in cryptocurrency. The Macau store opened in November 2025.
91 receiving addresses ultimately converge to one address
The 99 addresses are functionally divided into four layers, none of which retain funds, as shown in Figure 1.
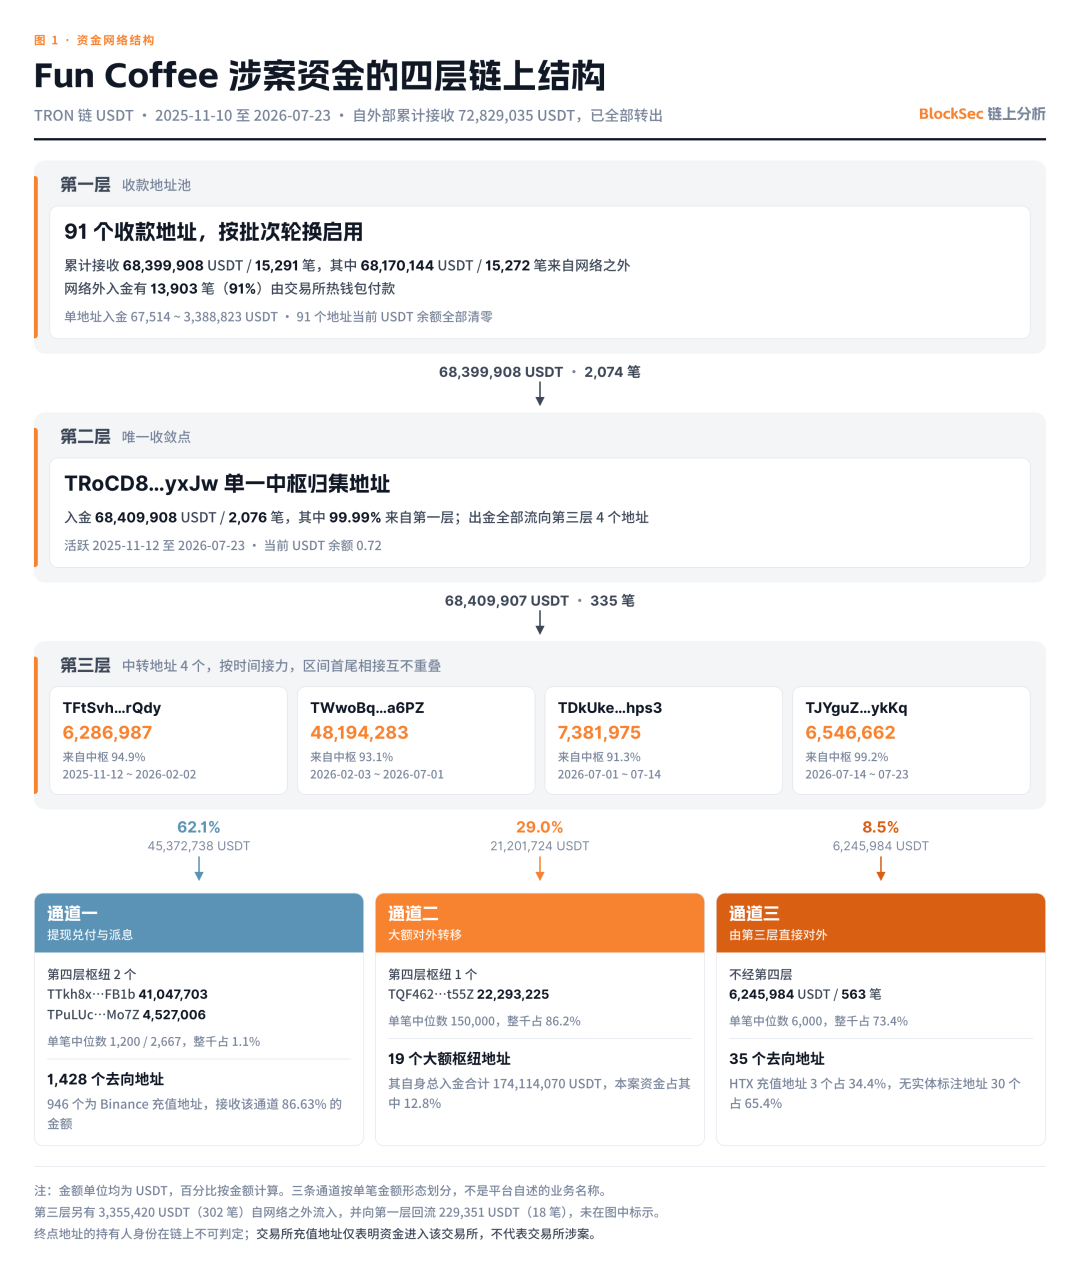
Image · Four-layer on-chain structure of Fun Coffee's involved funds
The first layer consists of 91 receiving addresses. The receiving addresses publicly disclosed by the platform are continuously changed, operating in a pool of addresses that are rotated by batch usage, with each address receiving between 67 and 649 deposits. Of the 15,272 external deposits received by these addresses, 13,903 (91%) came from exchange hot wallets, meaning retail users transferred coins directly from their exchange accounts; the percentage of such receipts among individual addresses ranged from 78.7% to 98.2%, with none lower than 50%, fully matching the methods of operation disclosed by the Hong Kong police.
The second layer has only one address, where all the funds received from the first layer are consolidated, with 99.99% of deposits coming from the first layer, while all outflows go to four intermediary addresses in the third layer, keeping nothing for itself. This is the only convergence point in the entire network, and because there is this convergence point, we were able to piece together the entire structure starting from the transfer records of one victim.
The third layer consists of four intermediary addresses, used sequentially. The intervals for the central authority to allocate funds to these four addresses are consecutive and non-overlapping, with all three handovers occurring on the same day (from February 2 to 3, 2026, July 1, and July 14). This does not appear to be four parallel roles but rather looks like the same functional attribute wallet that has changed three times. The fourth layer consists of three disposal hubs, where 91.1% of the outflows from the third layer converge, and funds are diverted according to their intended use. One of the payout hubs was only active from July 15 to 23, 2026, just coinciding with the window when the platform stopped operating and Hong Kong and Macau police began receiving reports; this was the last payout address to take over after the previous hub ceased operation.
Two details do not conform to this neat layering and require clarification. First, not all funds flow down to the fourth layer; 8.5% (a total of 6,245,984 USDT) of the outflows from the third layer left the network directly from this layer; second, not all funds came in from the first layer; another 3,355,420 USDT (302 transactions) in the third layer came directly from external sources, and the two hubs in the fourth layer held 1,293,472 USDT that had never touched the receiving addresses.
Deposit steadily increased over nine months, while address pool shrank
Figure 2 shows the monthly deposit scale for the first layer of 91 receiving addresses. There was not a single decline over the nine months, increasing from 518,213 USDT to 14,349,354 USDT, making the last month's total 27.7 times that of the first month. The month with the highest deposits was precisely July 2026, the month the platform ceased operations, indicating that the intensity of fundraising before the shutdown was still at its peak and the platform did not shut down after running out of funds.
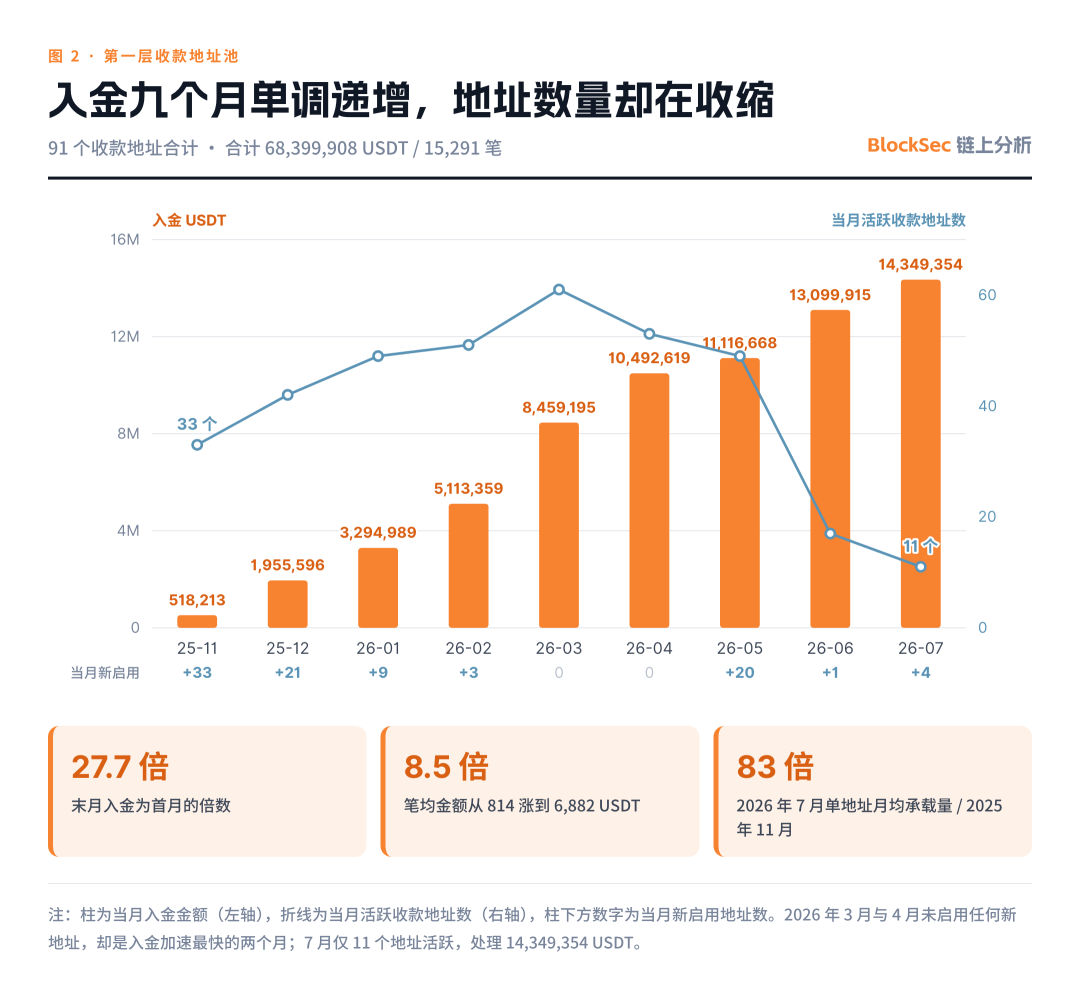
Image · Deposits steadily increased over nine months, yet the number of addresses shrank
What is even more noteworthy is the decoupling of address quantity from deposit scale. In March and April 2026, no new addresses were activated, yet those were the months with the fastest acceleration in deposits; by July, only 11 addresses were active, handling 14,349,354 USDT, with an average of 1,304,487 USDT per address, which was 83 times that of November 2025. The address pool did not gradually expand with the scale of funds; instead, it was expanded in batches, with 33 addresses activated at once in November 2025 and 20 in May 2026, while the remaining months saw little to no additions, relying on increasing the capacity of individual addresses to accommodate the growth. The first batch of 33 addresses coincided with the month of the Macau store's opening.
Additionally, one data point indicates changes more effectively than total amounts: the average amount per transaction rose from 814 USDT to 6,882 USDT, increasing by 8.5 times. Not only did the number of participants increase, but the amount invested per transaction also systematically rose, leading to larger bets as time went on.
Whether money is returned to investors or siphoned away can be differentiated by transaction amount
The network has three external exit points. To determine each exit point's function, we use the pattern of single transaction amounts as a basis.
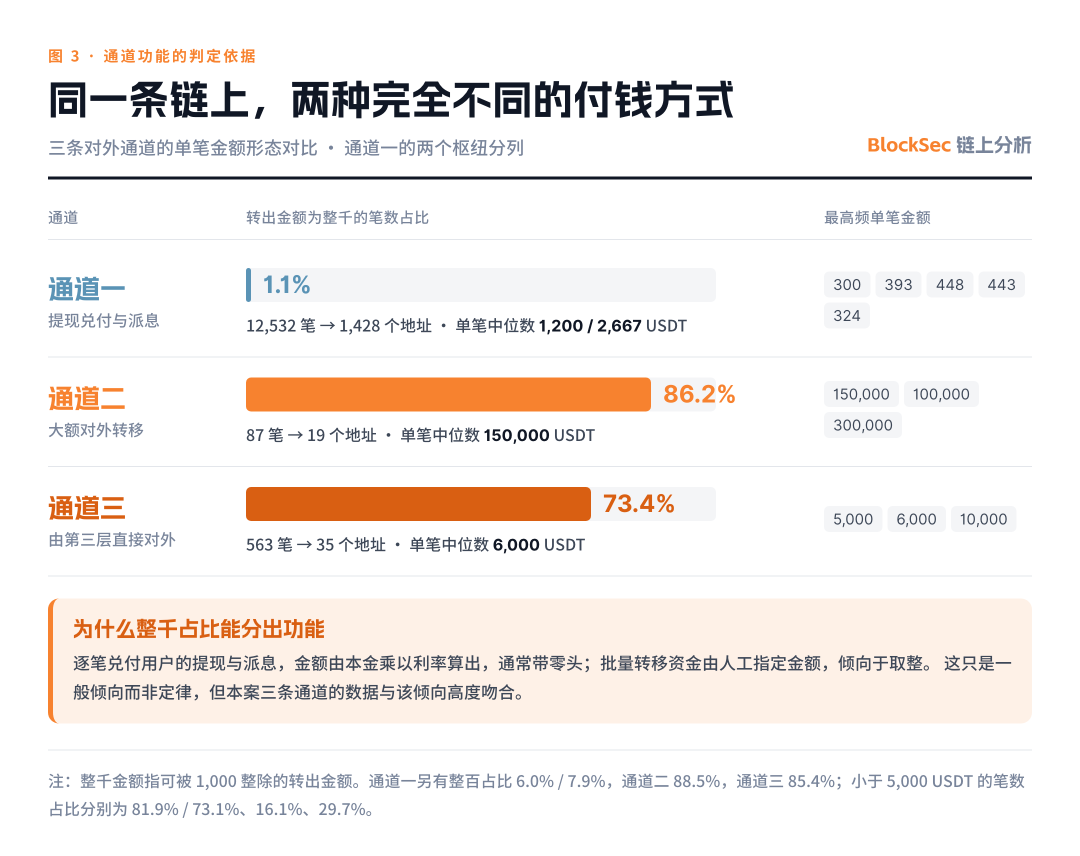
Image · Comparison of single transaction amounts for the three external channels
Figure 3 shows the starkest discrepancy is in the proportion of rounded amounts. Transfers through channel one almost never round off, with rounded amounts making up only 1.1%, while the most frequently occurring amounts are such as 393, 448, 324, which include decimal points; by contrast, channels two and three have 86.2% and 73.4% in rounded amounts respectively, with the most common transaction amounts being whole numbers like 150,000, 5,000, 10,000. This difference arises from the method of generating amounts: user withdrawals and dividends are calculated based on principal multiplied by interest rates, which typically results in decimal amounts; bulk transfers of funds have manually specified amounts, which are often whole numbers.
This is a general tendency rather than a law; the platform could round off dividends and the transferrer could deliberately use non-integral amounts. However, the data in this case aligns quite well with this tendency, and given that channel one consists of 12,532 small payments going to 1,428 addresses, and channel two consists of 87 large payments to 19 addresses, the nature of the two can be reasonably determined.
Channel one is the payout channel, with 45,574,708 USDT divided into small amounts flowing back to investors and team leaders, of which 86.63% went into 946 Binance refill addresses. Channels two and three are for moving money out of the network; the 19 downstream addresses in channel two are independently operating large hubs that accumulated a total of 174,114,070 USDT in deposits, with amounts from this case making up only 12.8% of that total, while the sources of the remainder have yet to be traced.
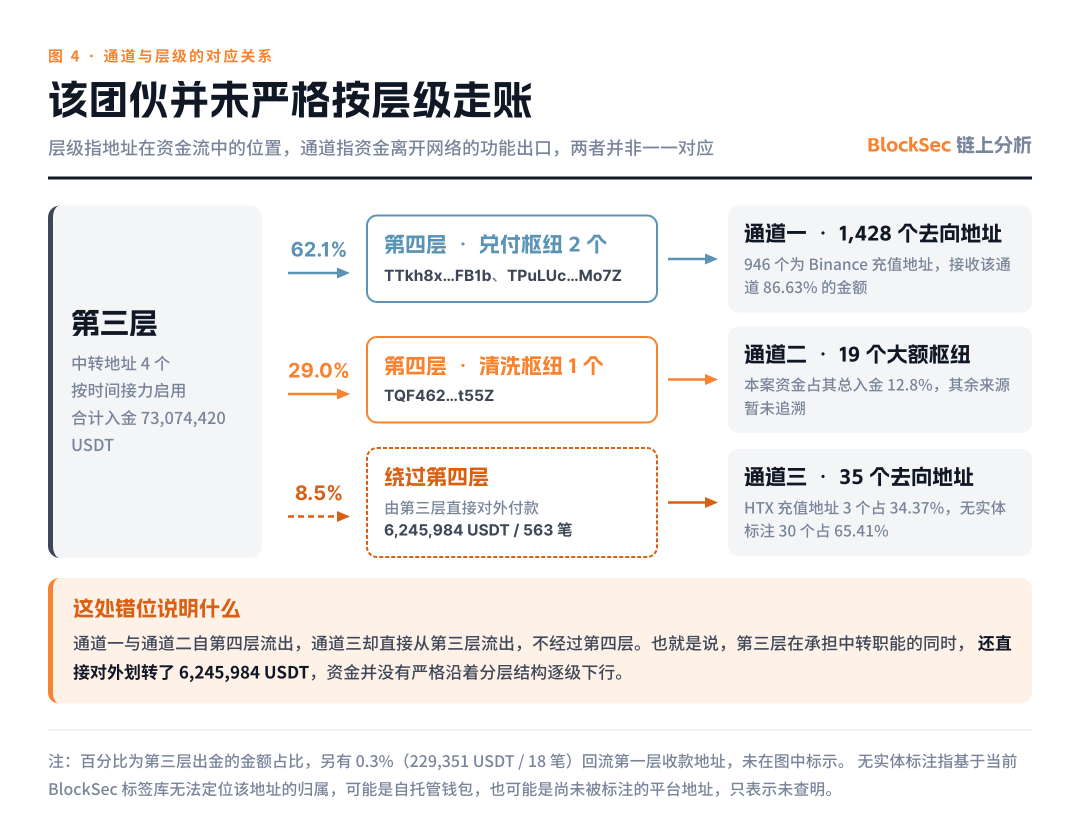
Image · Correspondence between channels and layers
Layers and channels do not correspond one-to-one. Figure 4 shows that channels one and two flow out from the fourth layer, while channel three flows directly from the third layer, bypassing the fourth layer. This misalignment indicates that the group did not strictly follow the layers for accounting; the third layer, while serving a transfer function, also directly transferred 6,245,984 USDT out of the network. Based on functional classifications, of the 72,829,035 USDT flowing out of the network, 45,389,827 USDT flowed out through the payout channel, with 27,439,208 USDT transferred out through channels two and three, approximately 62% and 38% respectively.
On-chain analysis can trace identifiable investors, most of whom have recovered their principal
The conclusions in this section apply only to the portion of investors that can be uniquely identified on-chain, which needs clarification. For those who sent funds directly from their wallets to the receiving addresses, every transaction can be traced back to specific addresses; however, for those investing via exchange accounts, the payers are exchange hot wallets, which are backed by thousands of users, making it impossible to attribute any specific transaction to any individual. After excluding addresses belonging to the network itself and dust addresses with contributions below 100 USDT, 175 of the former remain.
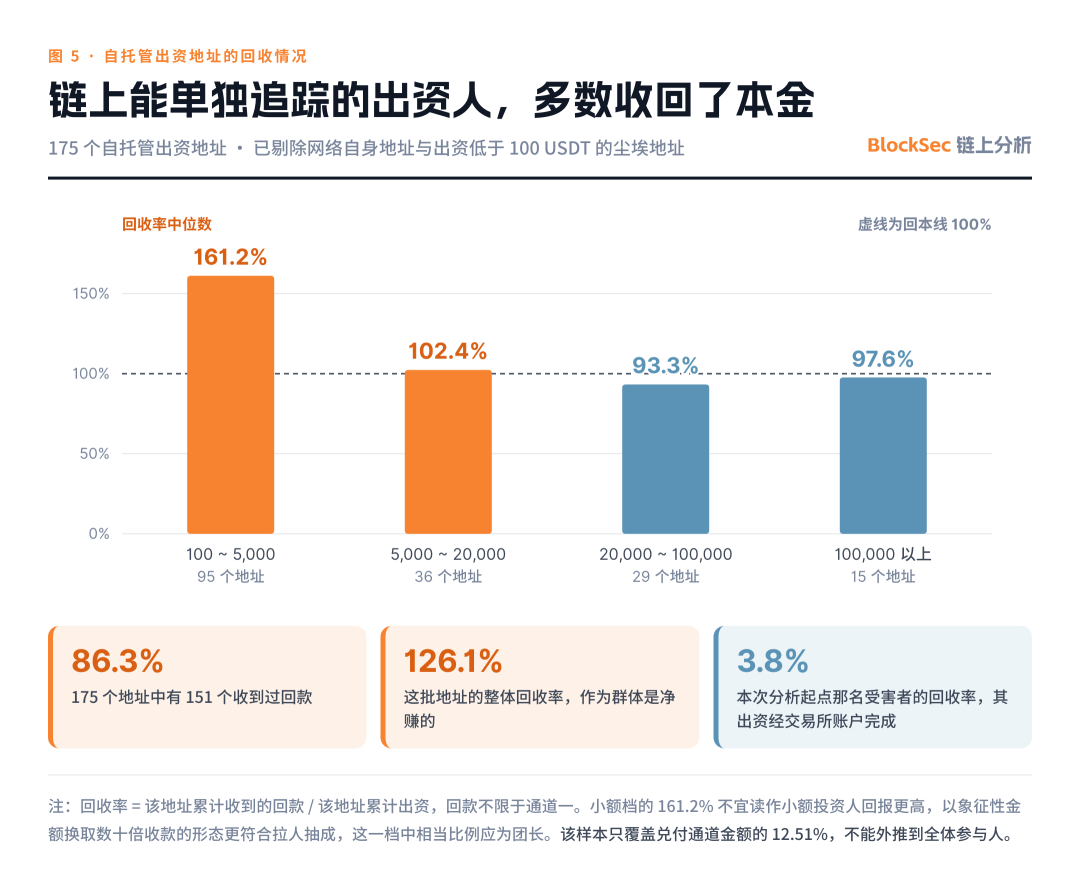
Image · Recovery situation of self-custodied investing addresses
Out of the 175 addresses, 151 (86.3%) have received repayments, with cumulative investments of 6,211,277 USDT and cumulative receipts of 7,830,067 USDT, resulting in an overall recovery rate of 126.1%, with 110 addresses (72.8%) achieving recovery rates of 100% or more, netting a profit as a group; another 24 addresses did not recover any amount after investing, with a total investment of 466,630 USDT. Figure 5 displays the median recovery rates segmented by investment amounts, decreasing with the scale of investment.
Grouping by the month of the initial investment does not show a decreasing trend over time; the median recovery rates for each month fluctuate between 75.0% and 183.2%, with the earliest participants from November 2025 having a median of 113.4%. In other words, the typical narrative of early participants profiting while later ones lost their principal did not play out among this sample.
This phenomenon must be contextualized within the initial timeline. The fund was not shut down due to exhaustion; the fundraising amount during the month of shutdown was the highest in nine months; what truly interrupted it were the risk warnings from overseas police in May and the warning list from the Hong Kong Securities and Futures Commission on July 13. The platform subsequently ceased operations on July 20, and criminal investigations began only afterward. A funding scheme interrupted by external factors while still ample in capital had not reached the stage of ceasing repayments.
This also explains why a project claiming an annualized return of 278% could last for nearly a year: early participants truly received funds, and their experiences became proof for the platform to continue attracting new capital. The Hong Kong police's description of the victims' mindset aligns with this, indicating participants "only saw others succeed in their investments and received small returns after investing themselves, leading them to believe in the plan's validity and lower their guard, subsequently increasing their investment amounts."
A recovery rate of 126.1% does not represent all participants
This set of data has two significant limitations that must not be overlooked. The first limitation is the coverage range. Comparing the amounts received to amounts invested applies only to self-custodied addresses; for the holders of exchange recharge addresses, their contributions are reflected on-chain as payments from hot wallets, thus making comparisons impossible. These 175 addresses account for only 12.51% of the payout channel amounts, while 946 Binance recharge addresses, which represent 86.63% of the total, are completely outside the applicable scope; by the number of transactions, participants who invested through exchanges constitute 91% of the transaction volume in the first layer.
The second, more critical limitation: while this group is net positive as a whole, it precisely indicates that this portion of identifiable on-chain investors cannot be representative of the average victim. Participants using self-custodied wallets for this type of scheme are often more active, invest larger amounts, and enter the scheme earlier, with a considerable proportion being team leaders. This pattern is clearly observable on-chain, with one address investing 581 USDT yet receiving 100,434 USDT in total, differing by a factor of 173, along with other instances differing by 100 times, 75 times, etc. Any inference regarding victim losses made based on this sample will systematically underestimate the actual losses.
However, we have left room for the judgment regarding team leaders. Team leaders who earn commissions for bringing in new members and early investors who exit profitably both exhibit a pattern of receiving amounts far exceeding their own investments on-chain; we cannot differentiate between the two based solely on this pattern, thus we do not draw such conclusions for any specific address. Similarly, the estimate of 1,650 to 1,950 participants derived from cross-referencing transaction counts and payout channel directions represents the scale of participants rather than that of victims, since the receiving addresses of the payout channels likely contained a mix of regular investors, team leaders, and unidentifiable operational cash-out accounts. This range also leans towards underestimation; based on the actual investment frequency of ordinary retail investors, the number of participants could be as high as the 7,000 range.
The victim referenced at the start of this analysis provides a direct comparison. His investment was completed entirely via an exchange account, with the payer being an exchange hot wallet, thus excluded from the aforementioned 175 addresses. However, his total received repayments amount to only about 3.8% of his investment, differing by two orders of magnitude from the overall recovery rate of 126.1% from the self-custodied sample. A single case does not constitute statistical evidence, but its direction aligns completely with the previous discrepancy: the unseen portion of participants likely has it much worse than those visible.
How much did participants actually lose?
There are three common metrics for losses, of which only one is suitable for participants to claim their losses. The platform's accounting metric is the cumulative value of participation displayed in the app, which includes reinvested portions of gains and level rewards, significantly exceeding the actual funds contributed by participants.
The on-chain cumulative reception metric refers to the total amount received by receiving addresses from outside the network, which amounts to 68,170,144 USDT this time. This is a verifiable scale of funds, but it does not equate to the loss amount: under a Ponzi structure, the same funds will circulate multiple times between investment and payout, meaning the cumulative reception amount must be greater than the actual net loss, and it is not possible to distinguish whether this total amount includes funds injected by the operators to create flow. The third type is the net loss metric, indicating the actual amount of loss suffered by participants overall, which is the only metric suitable for loss claims.
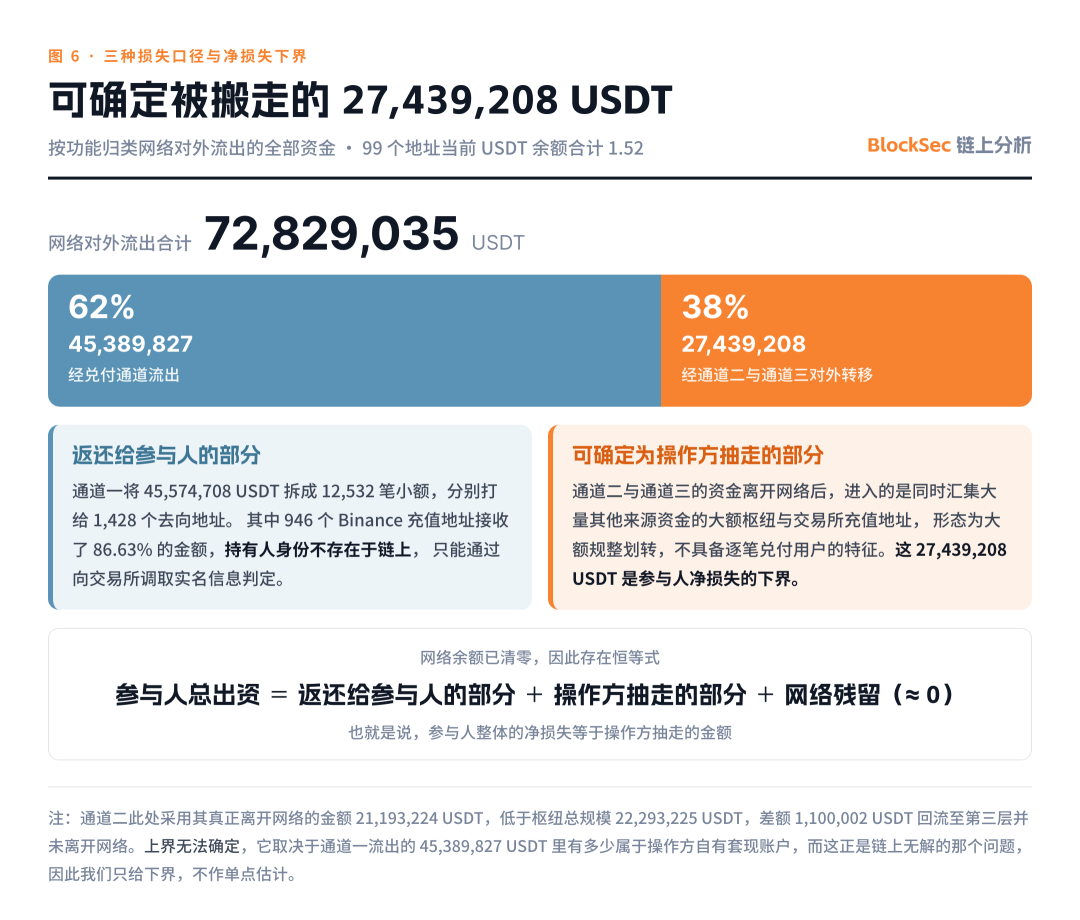
Image · Three loss metrics and the lower bound of net loss
As shown in Figure 6, since the funds of these 99 addresses have all been transferred out and the balances cleared to zero, there exists an identity: total contributions from participants = amount returned to participants + amount siphoned by the operators + network residue (≈ 0). In other words, the overall net loss for participants equals the amounts siphoned by the operators. Among the three channels, the funds leaving the network via channels two and three entered independent large hubs and exchange recharge addresses aggregating large amounts of funds from other sources, characterized by substantial standardized transfers, not reflecting the individual payouts to users. The amount that truly left the network via channel two is 21,193,224 USDT, and for channel three, it is 6,245,984 USDT, totaling 27,439,208 USDT, which represents the lower bound of participants' net losses.
We cannot determine the upper bound. The upper bound should be the lower bound plus the portion of the 45,389,827 USDT flowing out of channel one to the operators' cash-out account, which depends on how many of the 946 Binance recharge addresses belong to the operators, precisely the issue that remains unsolved on-chain. Therefore, this article only provides the lower bound without offering an upper bound or making specific estimates.
Even this lower bound relies on the premise that the destination addresses for the funds flowing out of channel three are indeed outside the network. Among the 1,636 external addresses that have had transactions with this network, 160 have had bi-directional flows, both sending funds to and receiving from the network. This form suggests that part of them might functionally belong to the same operator, though they were not included in the 99 addresses defined in this analysis; if subsequent verification incorporates them, the outflows from channel three and the net loss lower bound would require downward adjustment.
What can be answered by on-chain analysis, and what cannot?
Starting from a victim's transfer record, on-chain analysis provided the entire shape of the scheme: 91 rotating receiving addresses, a unique convergence point, four sequentially used intermediary addresses, three functionally distinguishable exit points, and 27,439,208 USDT that can be proven to have been siphoned away rather than returned to investors.
What cannot be provided is identity. Those 946 exchange recharge addresses holding 86.63% of the payout channel amounts mark the boundary of on-chain analysis. One exchange recharge address corresponds to an exchange account, but information regarding the account holder and whether they have also invested in the platform is not present on-chain and can only be resolved by retrieving real-name information from the exchange along with other offline materials. Beyond this point, the issue shifts from an analysis problem to a record problem in the hands of the exchange; the next step in such cases can only lead there.
Analysis scope: USDT on the TRON chain. Transaction data is up to August 24, 2026, with balance queries on August 25, and public source verification on August 25. Percentages in the text, unless indicated by address numbers, are calculated by amount. Addresses for which the entity affiliation cannot be identified on-chain are uniformly labeled as having no entity affiliation, indicating only that they have not been clarified and do not represent confirmed personal wallets. Exchange recharge addresses merely indicate that funds entered that exchange and do not imply that the exchange is involved in the case.
This restoration was completed by BlockSec's MetaSleuth fund tracing investigation platform, with entity affiliation determinations coming from our over 600 million on-chain address labels repository. The same capabilities also support BlockSec's Phalcon Compliance product, providing deposit tracing, address risk scoring, and transaction monitoring for exchanges, payment institutions, virtual asset service providers, and law enforcement and regulatory agencies. The on-chain forms of such funding schemes are highly similar: pools of rotating receiving addresses, single-point convergence hubs, intermediary wallets used sequentially, and parallel dual exit points for payouts and transfers. Identifying this structure while funds are still flowing through the network is much more valuable than tracing after a collapse.
免责声明:本文章仅代表作者个人观点,不代表本平台的立场和观点。本文章仅供信息分享,不构成对任何人的任何投资建议。用户与作者之间的任何争议,与本平台无关。如网页中刊载的文章或图片涉及侵权,请提供相关的权利证明和身份证明发送邮件到support@aicoin.com,本平台相关工作人员将会进行核查。


