Multiple indicators are releasing reversal signals; how will they develop over the next 18-24 months?
Written by: Anthony J. Pompliano, Founder and CEO of ProCap Financial
Translated by: Saoirse, Foresight News
Over the past year, Bitcoin has disappointed many investors. This much-anticipated digital asset has dropped from its historical peak of $125,000, falling more than 50%. But the good news is that the bear market is most likely over, and we are entering a new bull market.
The five charts below will give you hope for Bitcoin's earnings prospects over the next 18-24 months.
First, Quinten Francois shows the correlation between Bitcoin mining electricity costs and the Relative Strength Index (RSI). It is clear from historical trends that the two often hit bottom simultaneously.
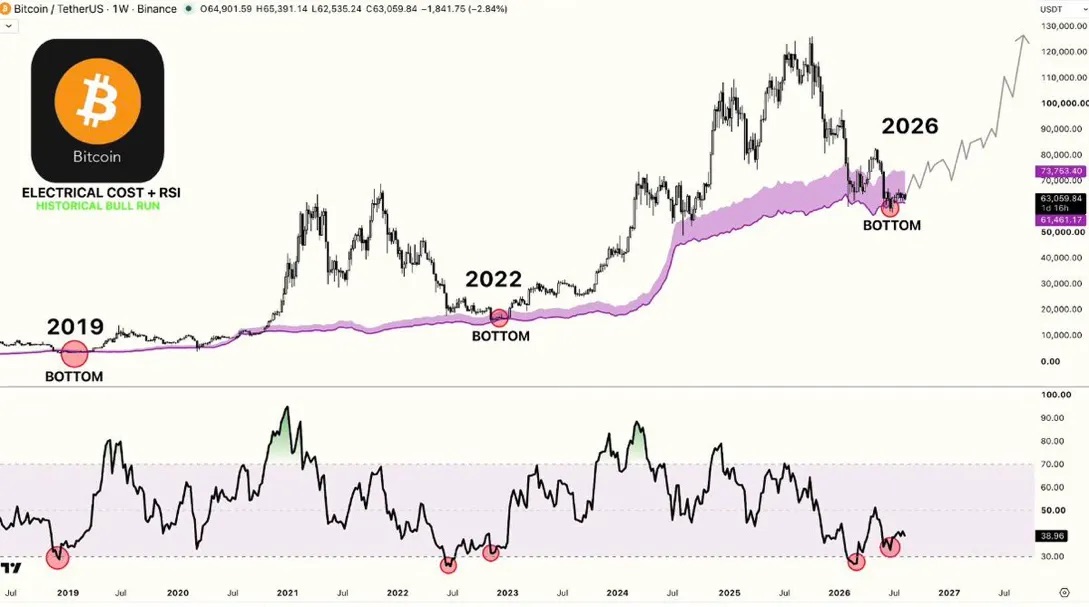
This Bitcoin weekly chart combines the mining electricity cost band (purple) with the RSI indicator, showing that in 2019, 2022, and 2026, the price retraced back to the cost band while the RSI hit bottom, often triggering a bull market thereafter in history.
If historical trends repeat, this would be a strong signal for the start of a bull market.
Second, Will Clemente points out that Bitcoin's correlation with gold has reached an all-time high. This is significant, as the recent commitment by Scott Bessent to expand government fiscal spending has reignited bets on currency depreciation.
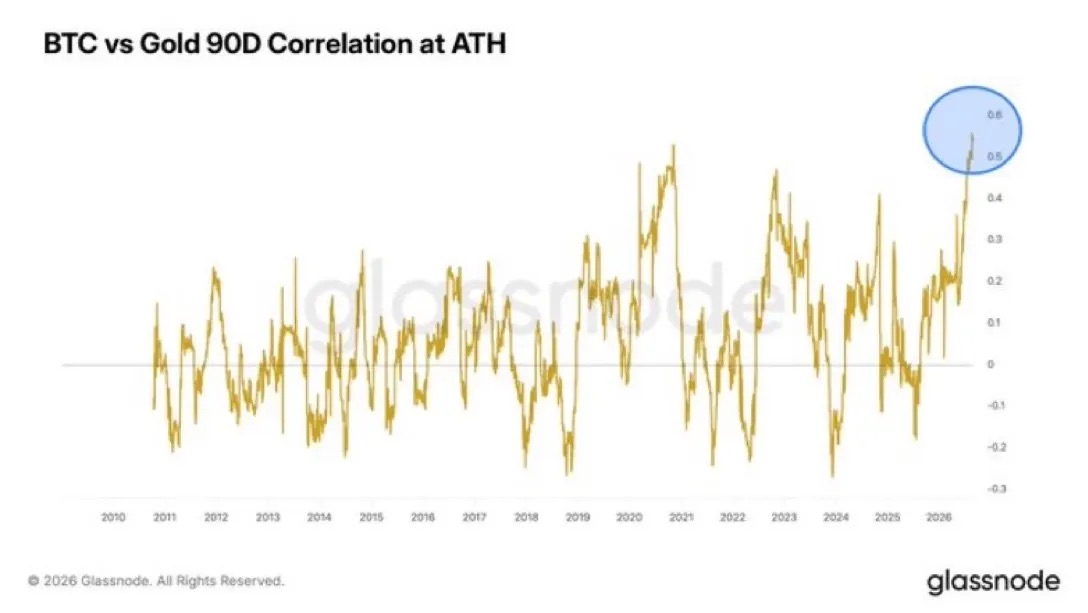
This Glassnode chart shows the 90-day correlation between Bitcoin and gold, with the correlation peaking in 2026, indicating that both are currently moving in sync and are considered assets that resist currency depreciation.
I constantly reiterate a classic viewpoint in the Bitcoin space: Bitcoin has no price ceiling, rooted in the fact that the dollar has no value floor. The U.S. national debt has surpassed $40 trillion, and the government continues to recklessly consume the dollar's purchasing power. It’s not hard to judge that this unchecked trend will continue if one thinks rationally.
Third, historically, Bitcoin's price movements have synchronized with the broad money supply M2, but there has been a significant divergence recently: M2 continues to expand while Bitcoin's price has fallen. Many have thus abandoned this indicator, but such significant divergences have also appeared multiple times in history. Whenever the gap between the two narrows again, it is often Bitcoin's price catching up, rather than a slowdown in M2 growth.
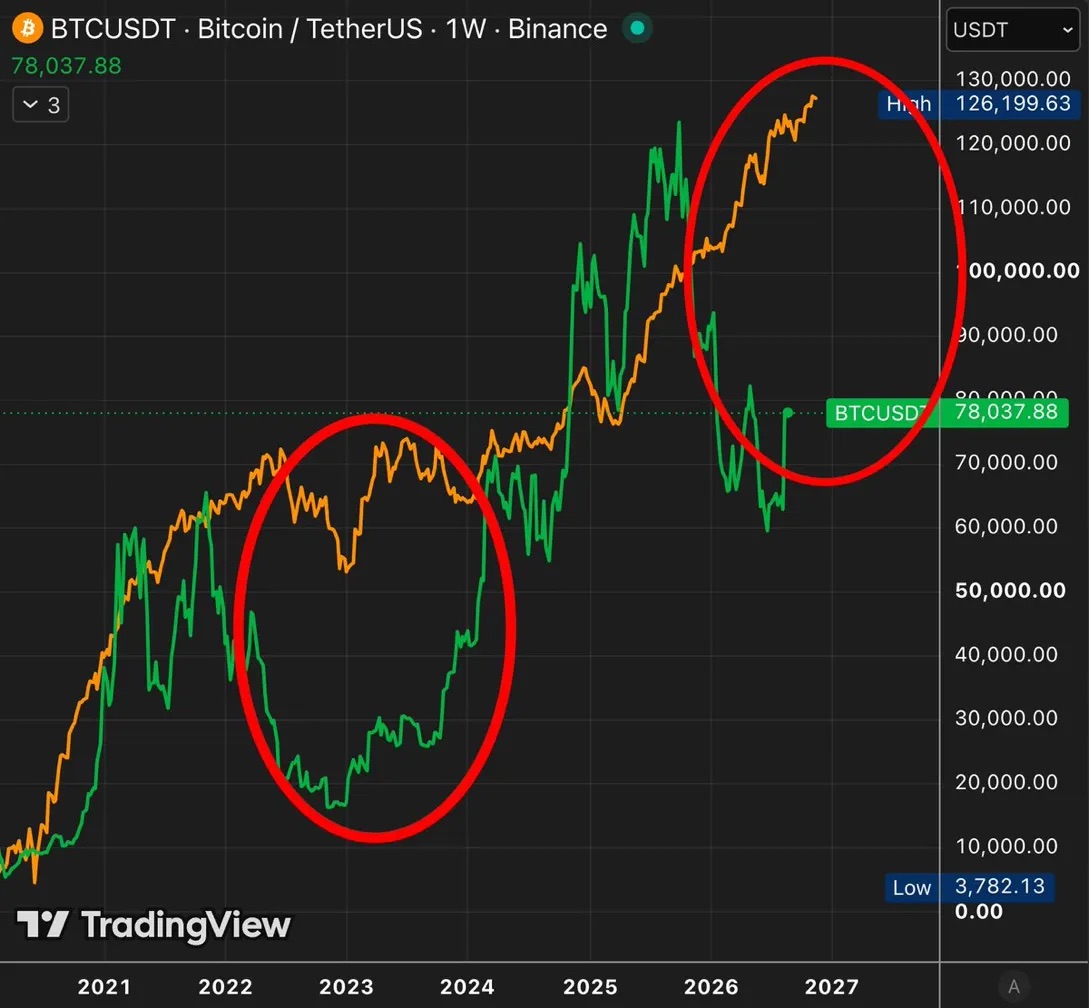
This weekly chart compares Bitcoin (green) with the broad money supply M2 (orange), showing two rounds of price divergence: after a large drop in price in 2022, Bitcoin caught up with the M2 increase, and in 2026, Bitcoin again underperformed money supply growth. Historical patterns suggest that Bitcoin will subsequently correct upwards to close this gap.
Fourth, I usually don't rely solely on chart lines to predict portfolio fluctuations, but this analysis from R89 Capital is quite convincing. Bitcoin seems to be starting a rebound from a key consolidation range bottom, indicating that the price is likely to rise in the coming weeks and even months.
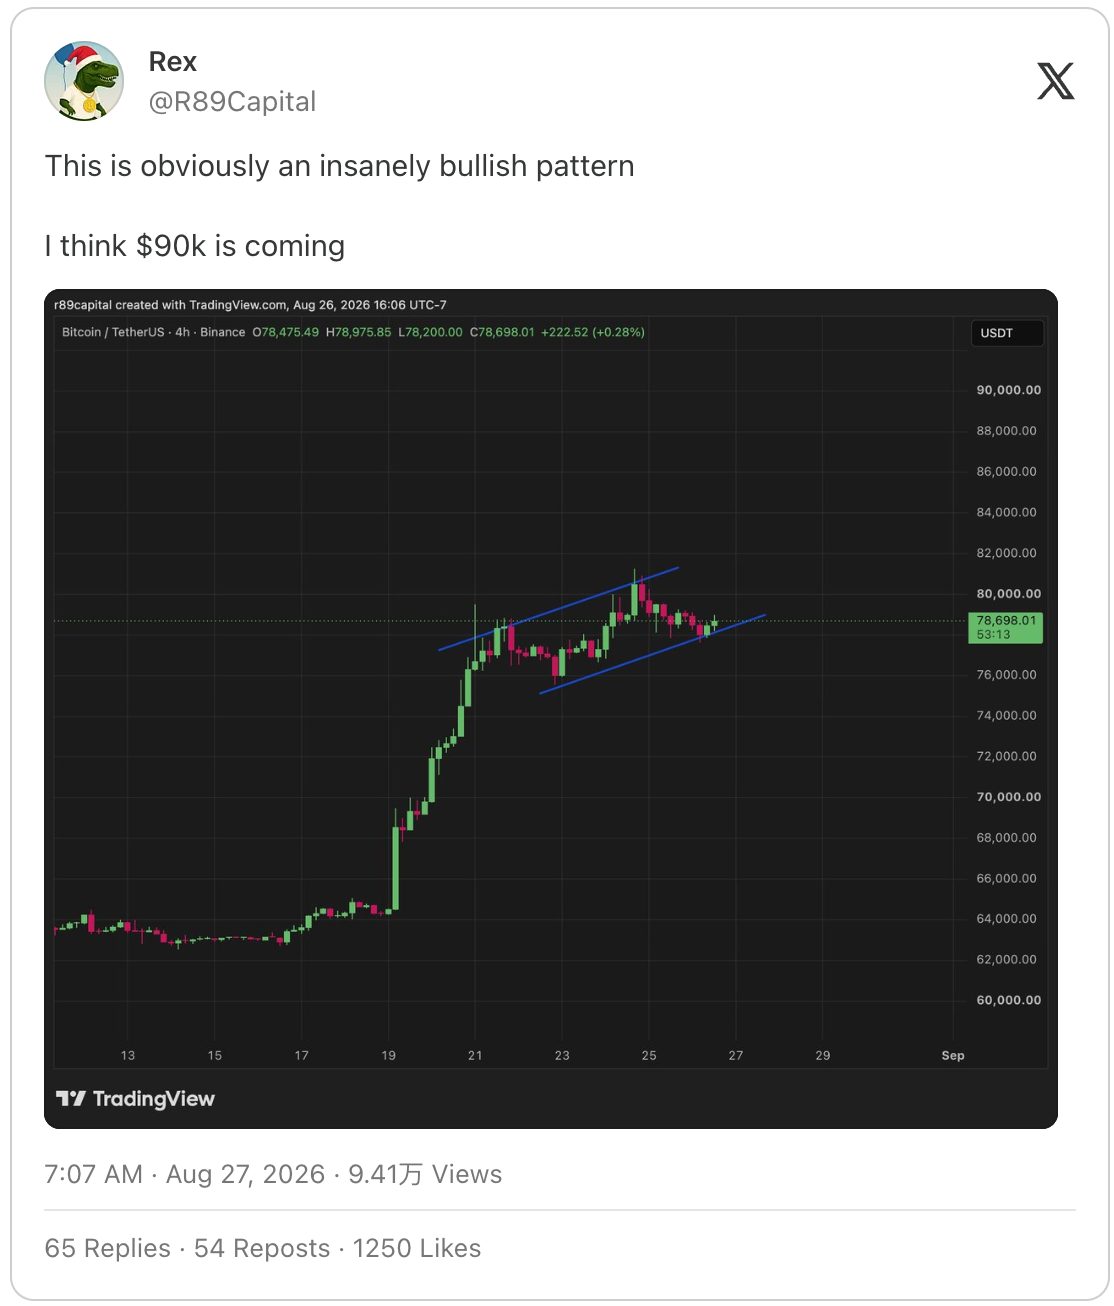
This is a 4-hour candlestick chart of Bitcoin created by R89 Capital, showing that the price has formed an upward channel pattern. The institution views this as a bullish signal, anticipating the price to advance towards $90,000.
Finally, the core truth of investing in Bitcoin: Long-term holding is far more effective than frequent timing trades. Jeff John Robert shared a Bloomberg chart, stating: "The investment logic of Bitcoin has become similar to that of the S&P 500 index, with the majority of returns coming from a few big rebound trading days. If you sell out at this time and miss these upward windows, the investment results will be very poor. Bloomberg's chart compares Bitcoin's annual return including and excluding the top ten explosive trading days."
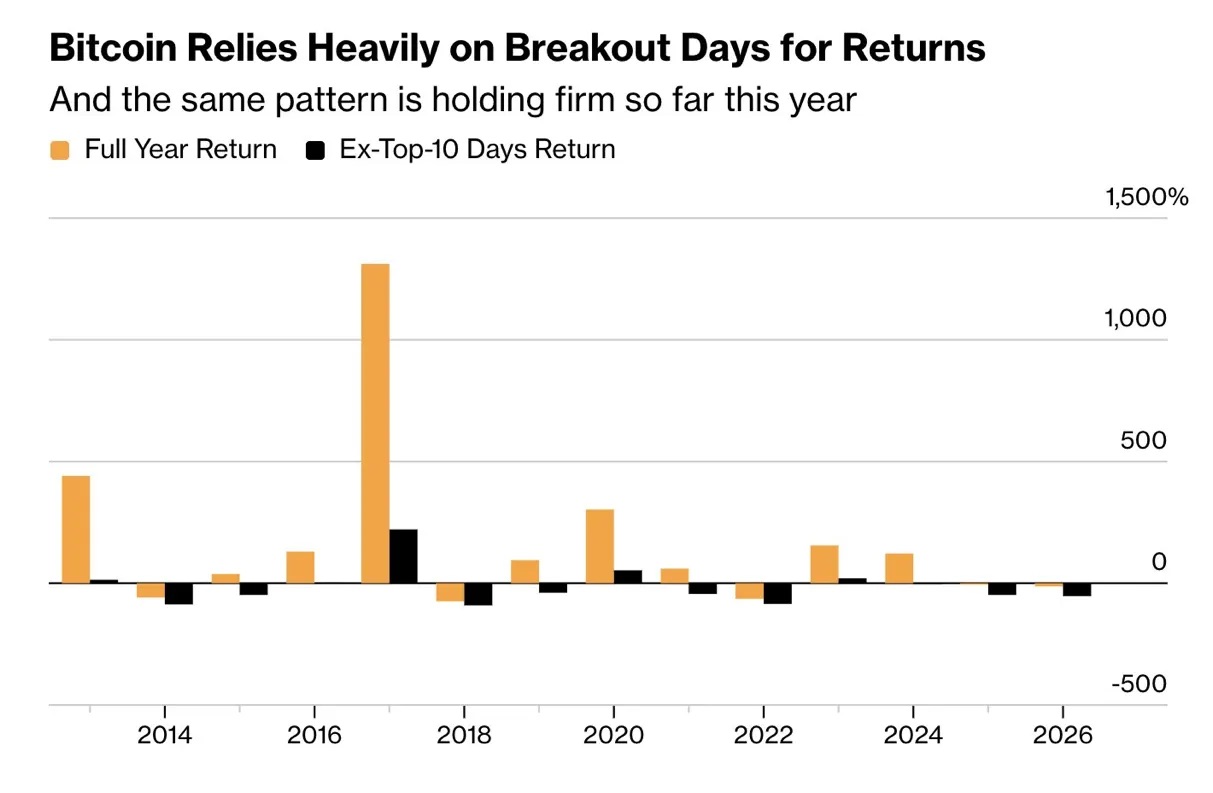
This chart compares the complete annual return of Bitcoin with the returns after excluding the top ten explosive trading days, indicating that most of Bitcoin's profits come from a few explosive trading days, and frequent timing trades can easily miss key market movements.
The reasoning is actually quite simple. This bear market in Bitcoin has lasted shorter and the drop has been smaller compared to past cycles. Don't obsess over looking back to the past; a new bull market is already here. Bitcoin is set to appreciate significantly from its current level. However, market fluctuations will be extremely intense, and such volatility is not suitable for investors with weak psychological endurance. Nevertheless, those who fully understand Bitcoin and stick to their positions through the dramatic fluctuations are likely to reap substantial rewards.
免责声明:本文章仅代表作者个人观点,不代表本平台的立场和观点。本文章仅供信息分享,不构成对任何人的任何投资建议。用户与作者之间的任何争议,与本平台无关。如网页中刊载的文章或图片涉及侵权,请提供相关的权利证明和身份证明发送邮件到support@aicoin.com,本平台相关工作人员将会进行核查。


