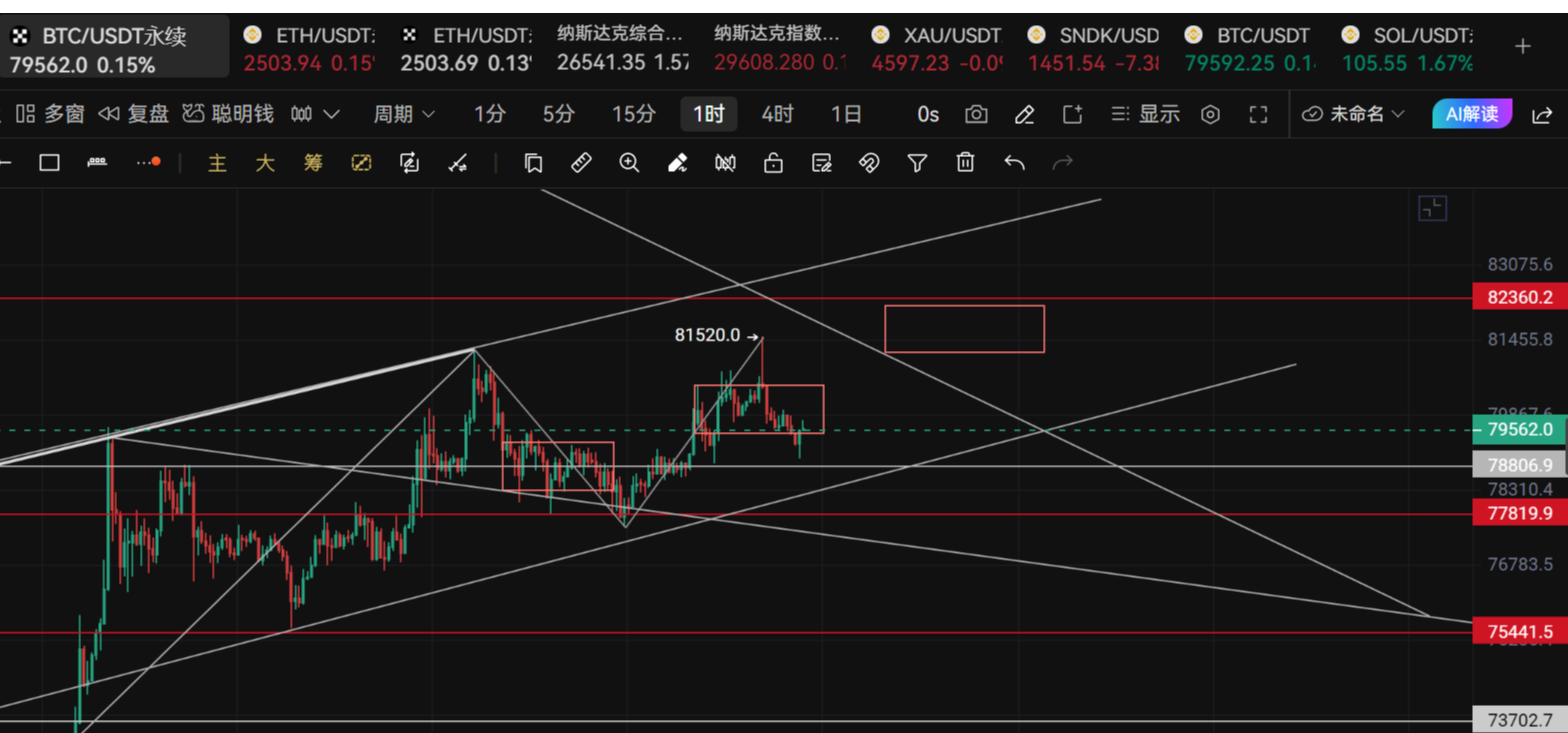
Cryptocurrency Expert: The ETH (Ethereum) Rally on August 28 is Not Over, but Risk Signals for Ethereum Have Emerged? Latest Market Analysis Reference
The current price of Ethereum is 2520. Watching the price rise, you neither dare to chase high entries nor fear missing out on a big market trend. This dilemma is likely the true state of many traders right now. As the market reaches this point, many cannot distinguish whether this is the beginning of a new bullish cycle or a trap to lure in buyers at high positions. Fearful of getting caught if they chase in, and worried that waiting might lead to further upward movements that leave them behind, we expand our gains in the north at 1600. The market always tests human nature. Never imagine you can catch every market move in trading; stick to your trading rules and prioritize risk management to survive long-term in the market.
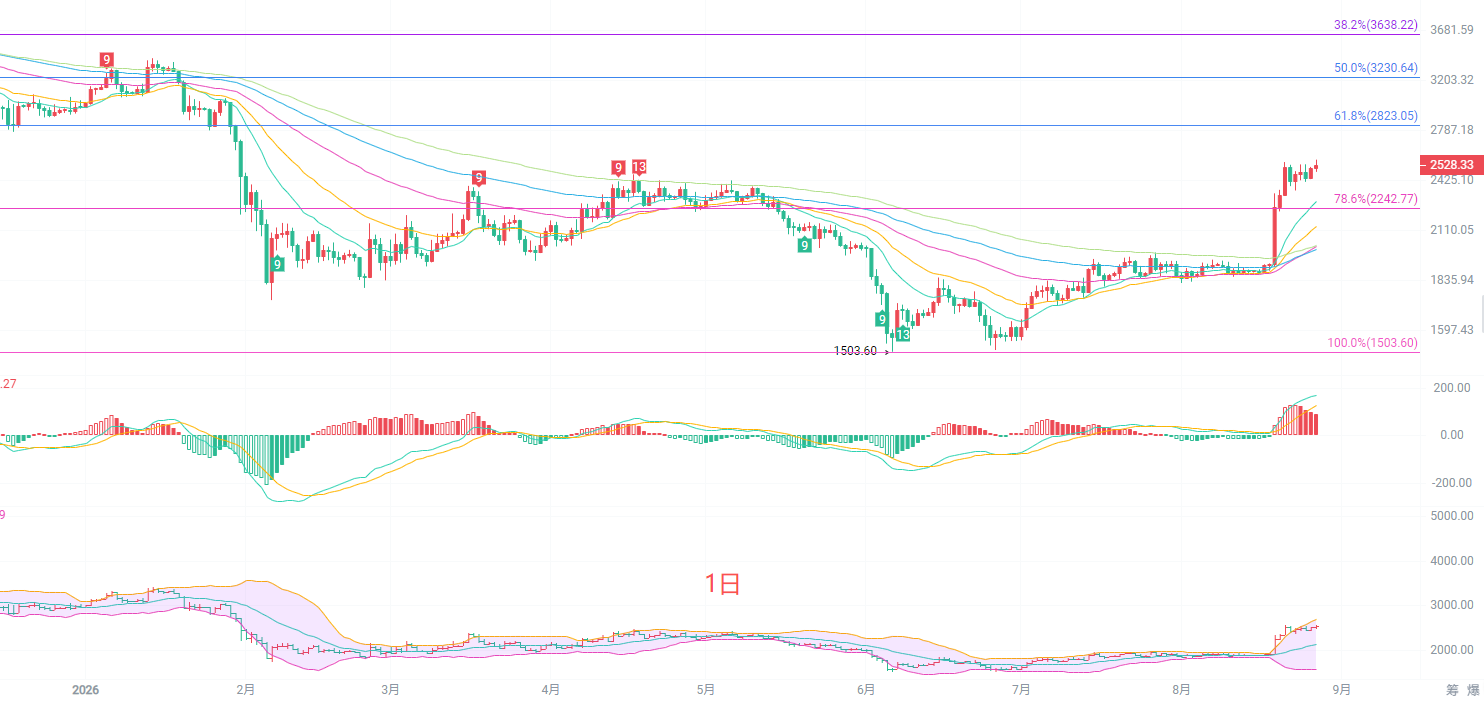
The daily K-line has initiated a strong rebound from the low point of 1503; the price is now above multiple EMA moving averages, with the short-term moving averages diverging upwards, establishing a bullish trend. The current price is close to the 78.6% Fibonacci level at 2242, with significant resistance expected in the range of 28233230 above. The MACD indicator's red bars continue to be maintained at a high level, indicating that bullish momentum is still sufficient, though divergence warnings are starting to appear. The Bollinger Bands are opening upwards, and the price runs near the upper band, indicating a strong bullish pattern. However, after consecutive daily gains, a correction may be needed at any moment. Avoid blindly chasing price increases on the daily line; wait for key support to be tested before considering positions, as caution is advised against a pullback after a high surge which could lead to significant retracements.
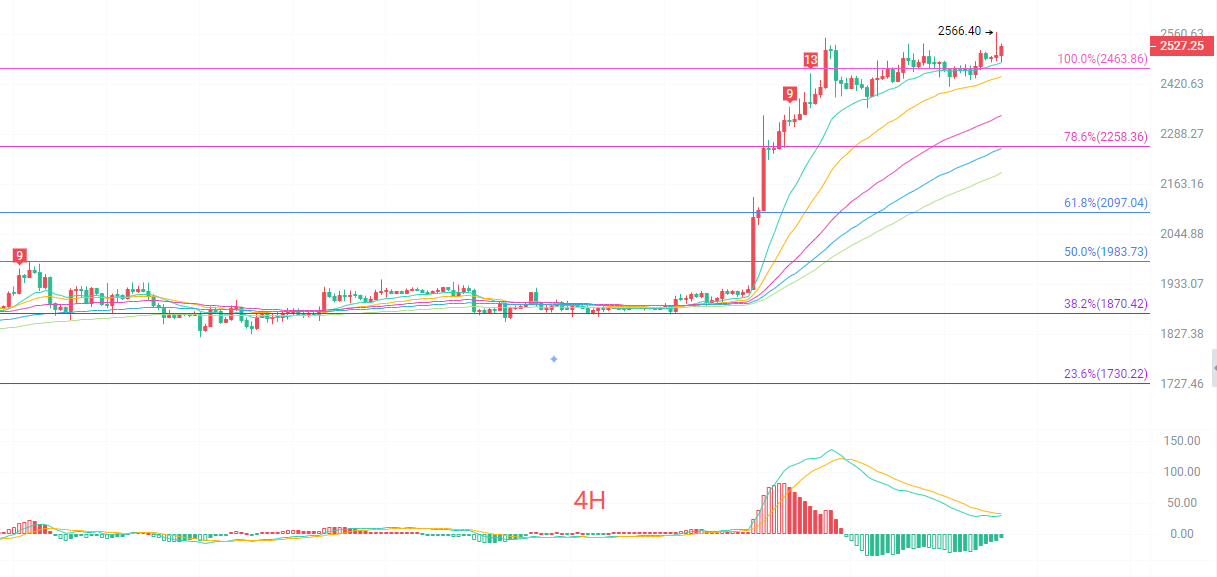
On the four-hour K-line, short-term EMA15 and EMA30 moving averages maintain an upwards trend, with the moving averages in good bullish arrangement, providing strong support. In terms of MACD, DIF and DEA have turned downward at high levels, with green bars continuing to be released, indicating that the four-hour level is undergoing a corrective phase after a rise. The upper Bollinger Band is at 2518, the lower band is at 2440, and the price is running closely along the upper band, with the fluctuation range gradually narrowing. There has been no direct shift to bearish in the short cycle, which belongs to a consolidation phase after a rise, with a key focus on the support level at 2463. Holding this position would maintain the bullish structure; a significant drop below could lead to further testing of support around 2350.
Short-term Reference:
If the price does not break below 2470 to 2450, it can move north, with a stop loss of 40 points, targeting 2560 to 2620.
If the price does not breach 2590 to 2610, it can move south, with a stop loss of 40 points, targeting 2550 to 2520.
Specific operations should be based on real-time market data. For more information details, you can consult the author. The publication of the article may be delayed, so it is recommended for reference only, with risks borne by the reader.

Kind Reminder: The above content is solely created by the author of the public account. The advertisements at the end of the article and in the comment section are unrelated to the author. Please be cautious in differentiating, thank you for reading.
免责声明:本文章仅代表作者个人观点,不代表本平台的立场和观点。本文章仅供信息分享,不构成对任何人的任何投资建议。用户与作者之间的任何争议,与本平台无关。如网页中刊载的文章或图片涉及侵权,请提供相关的权利证明和身份证明发送邮件到support@aicoin.com,本平台相关工作人员将会进行核查。