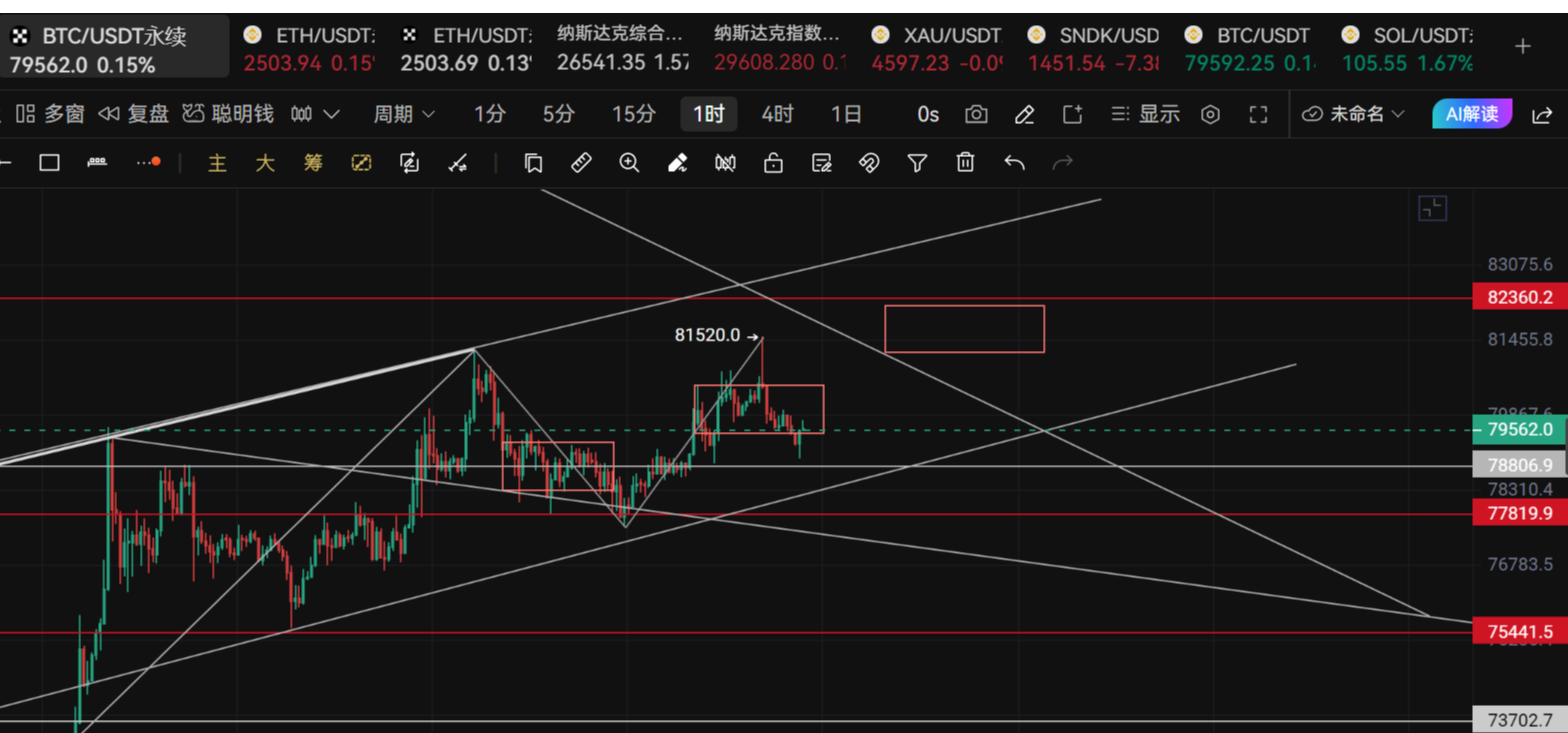
Academician of the Currency Circle: On August 28, the bullish pattern of Bitcoin (BTC) is established. What signals should we pay attention to regarding the release of cyclical divergence signals? Latest market analysis and operational advice explained.
Current Bitcoin price is 80500, and many friends who missed the opportunity have mixed feelings. If they chase, they fear buying at a high price; if they don’t chase, they worry that the market will continue to surge away. The market is always like this; when it rises sharply, there are bullish voices everywhere, and a bit of pullback spreads panic emotions instantly. Unlike when we held on from around 60000 until now, we remain calm and assured.
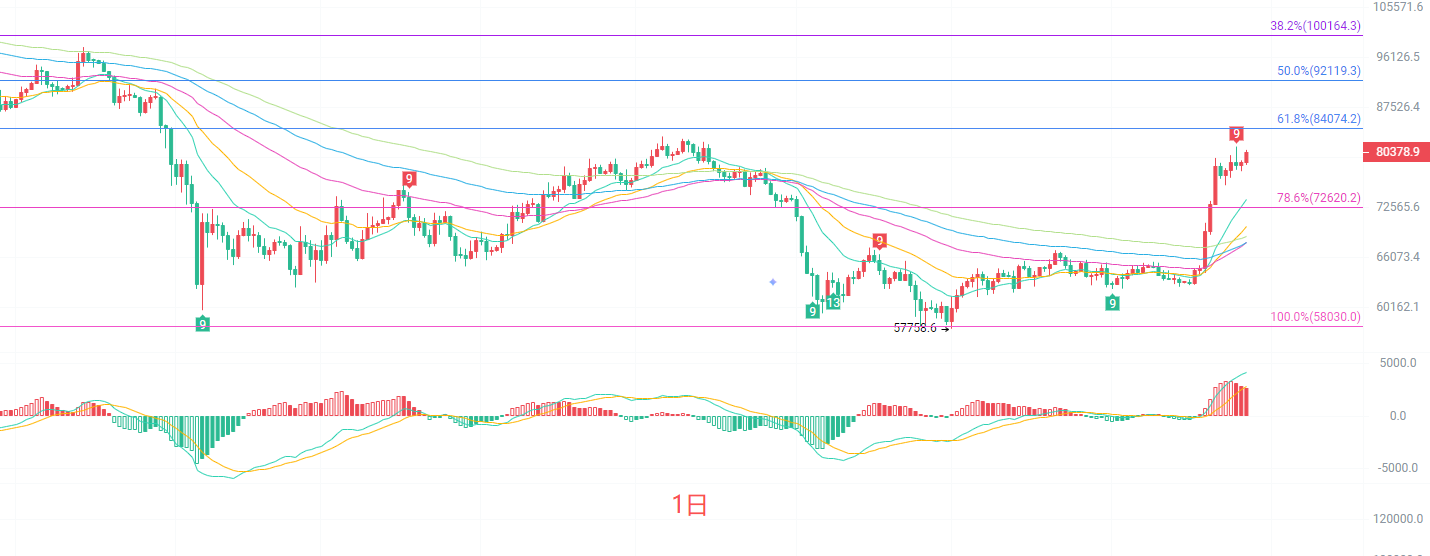
After the daily K-line strongly broke through the Fibonacci 78.6% position of 72620, it continues to expand upward. Currently, it stands firm above all EMA moving averages, with all moving averages turning upwards, indicating a complete bullish trend structure. The Bollinger Bands open upwards, and the price is running near the upper band, indicating a strong bullish market. The MACD indicator’s DIF remains above the zero axis with red histogram expanding; bullish momentum is still online. However, after consecutive rises, the red histogram shows slight signs of decline, and caution is needed for potential high-level corrections. The key resistance above is at the 61.8% Fibonacci position of 84074, while the support below is at 72620. After a big rise, a retest of the moving average to confirm support cannot be ruled out. One should not blindly chase, but wait for a retest of support before making considerations.
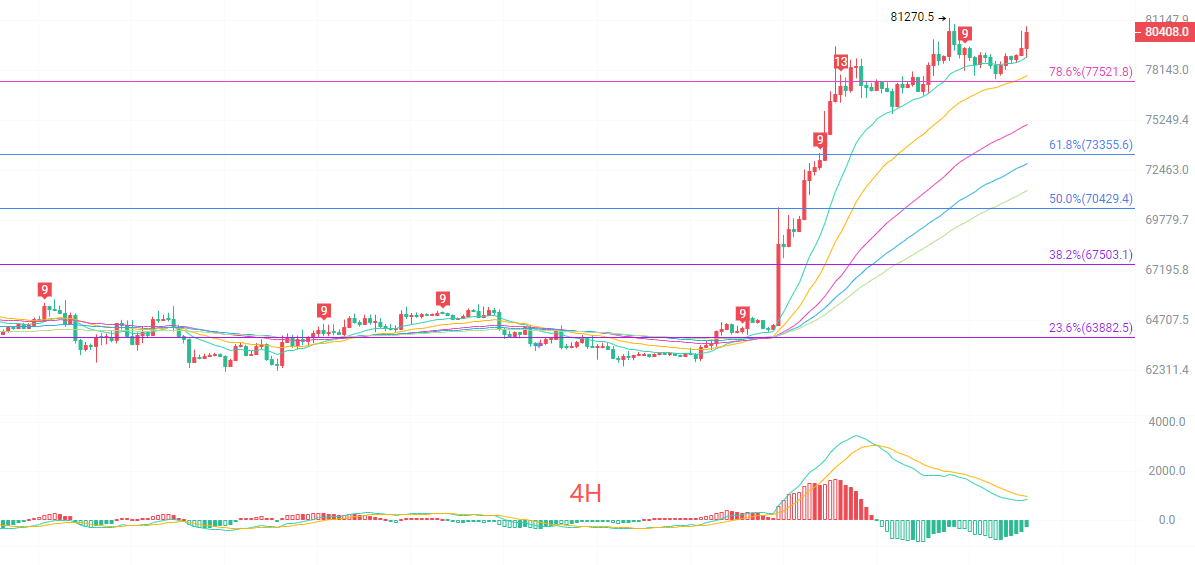
The four-hour K-line peaked at 81270 and has since experienced slight pressure and a retreat, currently maintaining a high-level range oscillation. The short-term EMA moving averages are in a bullish arrangement, with the price staying above the 30-period moving average, and the overall bullish direction has not been damaged. However, the MACD has shown a top divergence signal, with the red histogram continuously contracting and a slight green bar appearing, indicating a short-term exhaustion of upward momentum. The upper Bollinger band has begun to contract, and the price is running below the upper Bollinger band, suggesting a short-term demand for a pullback to digest profit-taking. The short-term pressure above is at 81270, with the first support below at 77521. If this position is broken, there will be further retest at 73355. The four-hour level warns against chasing high positions and to be cautious of short-term pullbacks for washout.
Short-term reference:
Buy from 78000 to 77500, stop loss at 77000, target at 81200 to 84000.
Sell from 81000 to 81500, stop loss at 81500, target at 79000 to 78000.
Specific operations should rely on real-time market data; for more detailed information, you can contact the author. There might be a delay in article publishing, and suggestions are for reference only. Risks are borne by oneself.

Warm reminder: The above content is created solely by the author of this public account. The advertisements at the end of the article and in the comments section are unrelated to the author; please discern carefully. Thank you for reading.
免责声明:本文章仅代表作者个人观点,不代表本平台的立场和观点。本文章仅供信息分享,不构成对任何人的任何投资建议。用户与作者之间的任何争议,与本平台无关。如网页中刊载的文章或图片涉及侵权,请提供相关的权利证明和身份证明发送邮件到support@aicoin.com,本平台相关工作人员将会进行核查。