Dear teammates, this morning's market is very interesting. Bitcoin has been fluctuating above 77,000, but the news is quite contrasting. On one side, a mysterious whale has dumped 7,700 BTC in three days, cashing out 577 million USD, and on the other side, the weekly net inflow of the US Bitcoin spot ETF has reached 1.918 billion USD, hitting a new high after the flash crash. This level of tug-of-war between bulls and bears indicates that the market is brewing a big trend. Meanwhile, Grayscale reports that Bitcoin may have bottomed, with this week providing a key signal for a cycle reversal, while the entire network has seen 1.675 billion USD in liquidations within 24 hours, with more than 280,000 people affected in a double liquidation. The leverage cleanup has been quite thorough. The current issue is that the 80,000 USD threshold is right in front of us, with the liquidation intensity for shorts reaching 1.398 billion USD. Once it breaks through, it will trigger a chain of liquidations, but the selling pressure from the whale is like a sword hanging over our heads. Which direction will the market go?
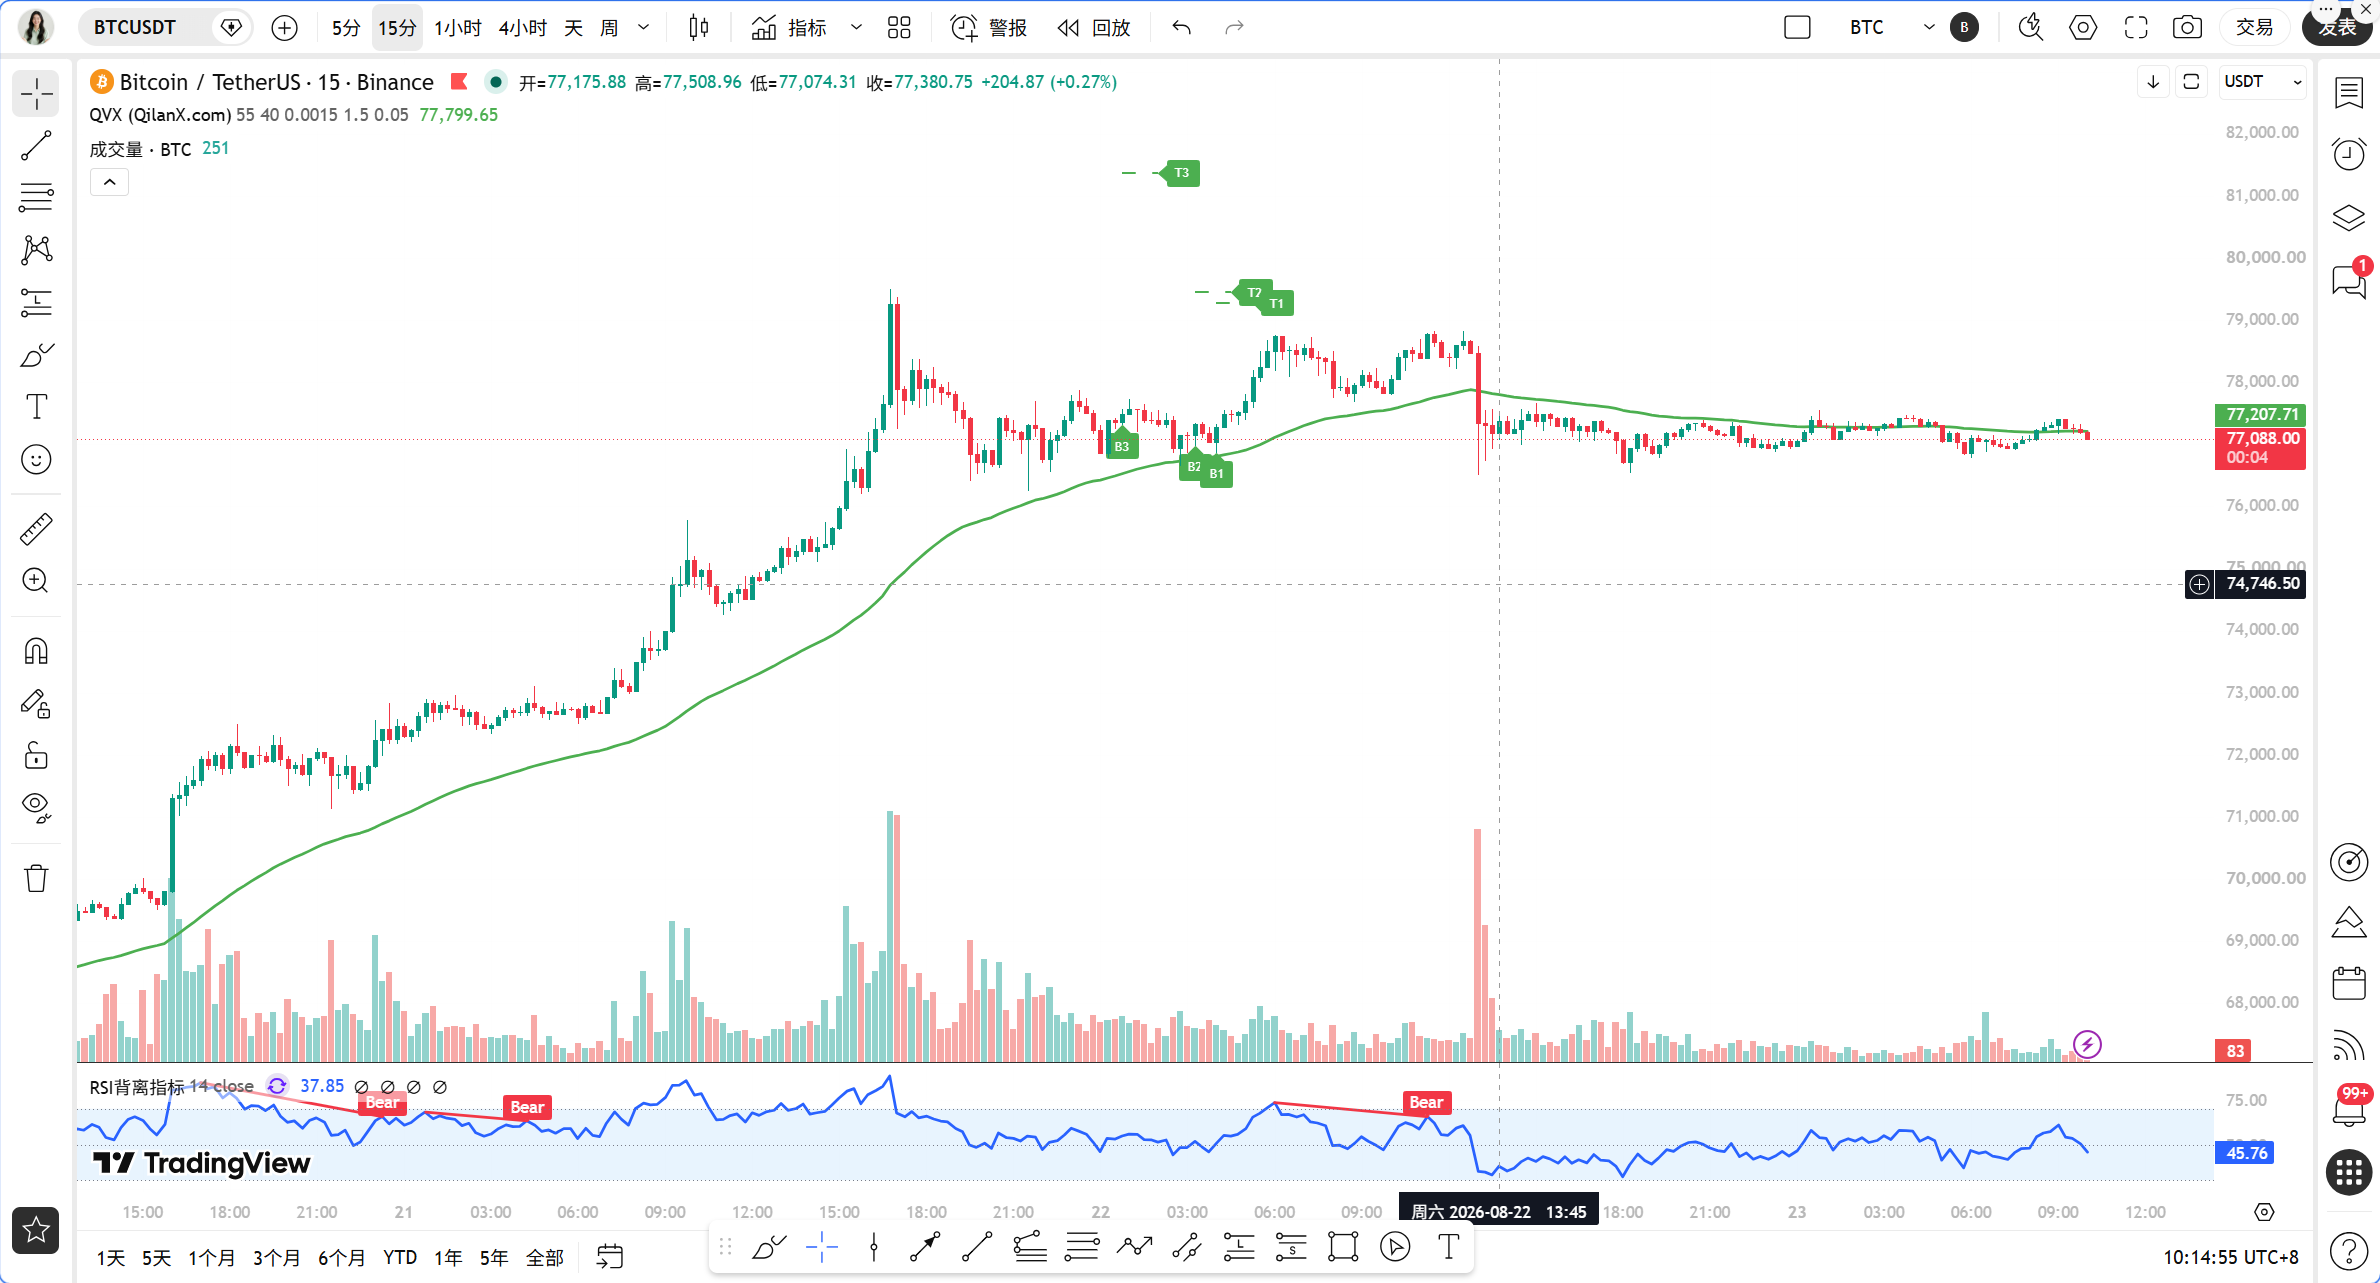
The current time is August 23 at 10:22 AM, with the BTC price at 77,050 USDT, a 24-hour decline of 0.77%. The price is repeatedly contested around 77,000, and the short-term direction is still unclear, but there are some signals in the technical structure worth noting.
First, let’s look at the long-term cycle. The daily MACD column value is 1585.11, still maintaining a positive value, with the DIF line at 2961.58 far above the DEA line at 1376.47, indicating that the bullish trend is not damaged. The RSI has reached 82.25, which has entered the overbought area, suggesting that while the daily bullish momentum is strong, the risk of overheating is also accumulating. The MA5 is at 74,964.58, the MA10 at 69,311.00, and the MA30 at 65,818.18, with the moving average system in a typical bullish arrangement, indicating that the mid-to-long-term trend is still upward.
The situation on the 4-hour level needs to be approached with caution. The MACD column value is negative at 216.44, and the DIF line at 2761.42 has fallen below the DEA line at 2977.85. Although a clear death cross has not yet formed, signs of diminishing momentum are very obvious. The RSI is at 76.12, also in the overbought range. The MA5 is at 77,130.41, the MA10 at 77,394.11, and the MA30 at 71,761.44, showing that the short-term moving averages are starting to flatten out, which indicates that the upward slope of the 4-hour level is slowing down, and the market needs time to digest the previous gains.
The 1-hour level is currently the most critical observation window. The EMA55 is at 76,165.93, and the current price of 77,050 is about 1.16% higher than the EMA55. In the past 8 1-hour candlesticks, the closing price was above the EMA55 8 times, with 0 crossings, indicating that the 1-hour level is in a clearly bullish trend zone, which does not meet the criteria for determining a choppy market. However, the MACD column value is at negative 64.06, with the DIF line at 39.39 clearly below the DEA line at 103.45, showing continued weakening momentum. The RSI is at 43.99, having fallen back into a neutral to weak area. The MA5 is at 77,123.13, MA10 at 77,173.75, and MA30 at 77,485.63, with the short-term moving averages sticking together, indicating that the 1-hour level is making a directional choice.
On the 15-minute level, the MACD has formed a death cross, with the DIF at negative 2.28, DEA at positive 1.44, and the column value at negative 3.72, indicating that short-term bearish momentum is being released. The RSI is at 53.01, which is in the neutral range, not providing a clear directional signal.
Let’s verify the current signals using the Qinglan TPV system. The price has closed above the EMA55 for the last 8 consecutive 1-hour candles, meeting the first condition for going long. However, for the second condition regarding support stabilization, there is currently no clear long lower shadow or bottom formation structure. The price is fluctuating around 77,000 without a clear stabilization signal. For the third condition regarding the exhaustion of bearish momentum, the MACD column value is negative, but the last two periods have not shown signs of continuous shortening, and the RSI has not rallied back from the oversold area. Therefore, while the current 1-hour level is in a bullish trend zone, the criteria for going long have not been fully met, requiring a wait for clearer signals.
Regarding on-chain data, there has been a net outflow of 2,721 BTC from centralized exchanges in the past 7 days, with Bithumb and Kraken leading the way. The reduced outflow from exchanges has led to a supply decrease, providing support for the price. However, short-term profits are being taken clearly, with 17,800 BTC flooding into Binance, hitting a new high since February, indicating that a large amount of short-term capital is cashing out. The mysterious whale has sold 7,700 BTC, cashing out 577 million USD, which is the largest source of selling pressure in the current market. However, the Bitcoin spot ETF saw a weekly inflow of 1.918 billion USD, setting a new high since the flash crash, and institutional funds are continuously absorbing these sold-off positions. The crypto fear index has returned to greed at 71, close to the high before the 10-11 crash, indicating that market sentiment is too hot and warrants caution against short-term adjustment risks.
As for key support and resistance levels, the first resistance level above is at 77,485, which is the position of the 1-hour MA30 and also an area of recent rebound highs. The second resistance level is at the round number of 78,000, and a breakthrough here will directly challenge the key psychological level of 80,000 USD, where there is a liquidation intensity of 1.398 billion USD for shorts. The first support level below is at 76,165, which is the position of the 1-hour EMA55 and is also the dividing line for the TPV system between bulls and bears. The second support level is at 74,964, which is the position of the daily MA5. If it breaks below this level, the bullish structure at the daily level will be threatened.
In terms of trading ideas, the current 1-hour level is in a bullish trend zone, but short-term momentum is weakening, making it unwise to chase high prices. I suggest waiting for a dip to confirm a low buy opportunity. Specifically, if the price dips to the range of 76,165 to 76,500 and signals a bottom formation or long lower shadow stabilization on the 1-hour level, and the MACD column value begins to shorten consecutively, a small position can be taken long, with a stop loss set below 75,800. The first target will be 77,485, and the second target will be 78,000. If the price breaks through 77,485 with volume and holds, we can wait for a dip to confirm before chasing long, targeting the range of 79,000 to 80,000. Conversely, if the price falls below 76,165 and two consecutive 1-hour candlesticks close below the EMA55, the bullish structure will be broken, and it will be necessary to decisively exit and observe, with support below being the 74,964 level.
Regarding risk warnings, the pressure from whale selling and profit-taking still exists, and with the fear index in the greed range, the market may experience a rapid pullback at any time, so please strictly control your position and manage your stop losses.
Follow Qinglan Crypto Class to seize more trading opportunities! Welcome to visit the official website www.qinglan.org
📊 Qinglan TPV Trading Strategy Backtesting Reference
🕒 Last backtesting time 08-23 07:00:01
Total analysis: 3664 Backtest: 3659 Accuracy rate: 79.8% (2921/3659)
免责声明:本文章仅代表作者个人观点,不代表本平台的立场和观点。本文章仅供信息分享,不构成对任何人的任何投资建议。用户与作者之间的任何争议,与本平台无关。如网页中刊载的文章或图片涉及侵权,请提供相关的权利证明和身份证明发送邮件到support@aicoin.com,本平台相关工作人员将会进行核查。