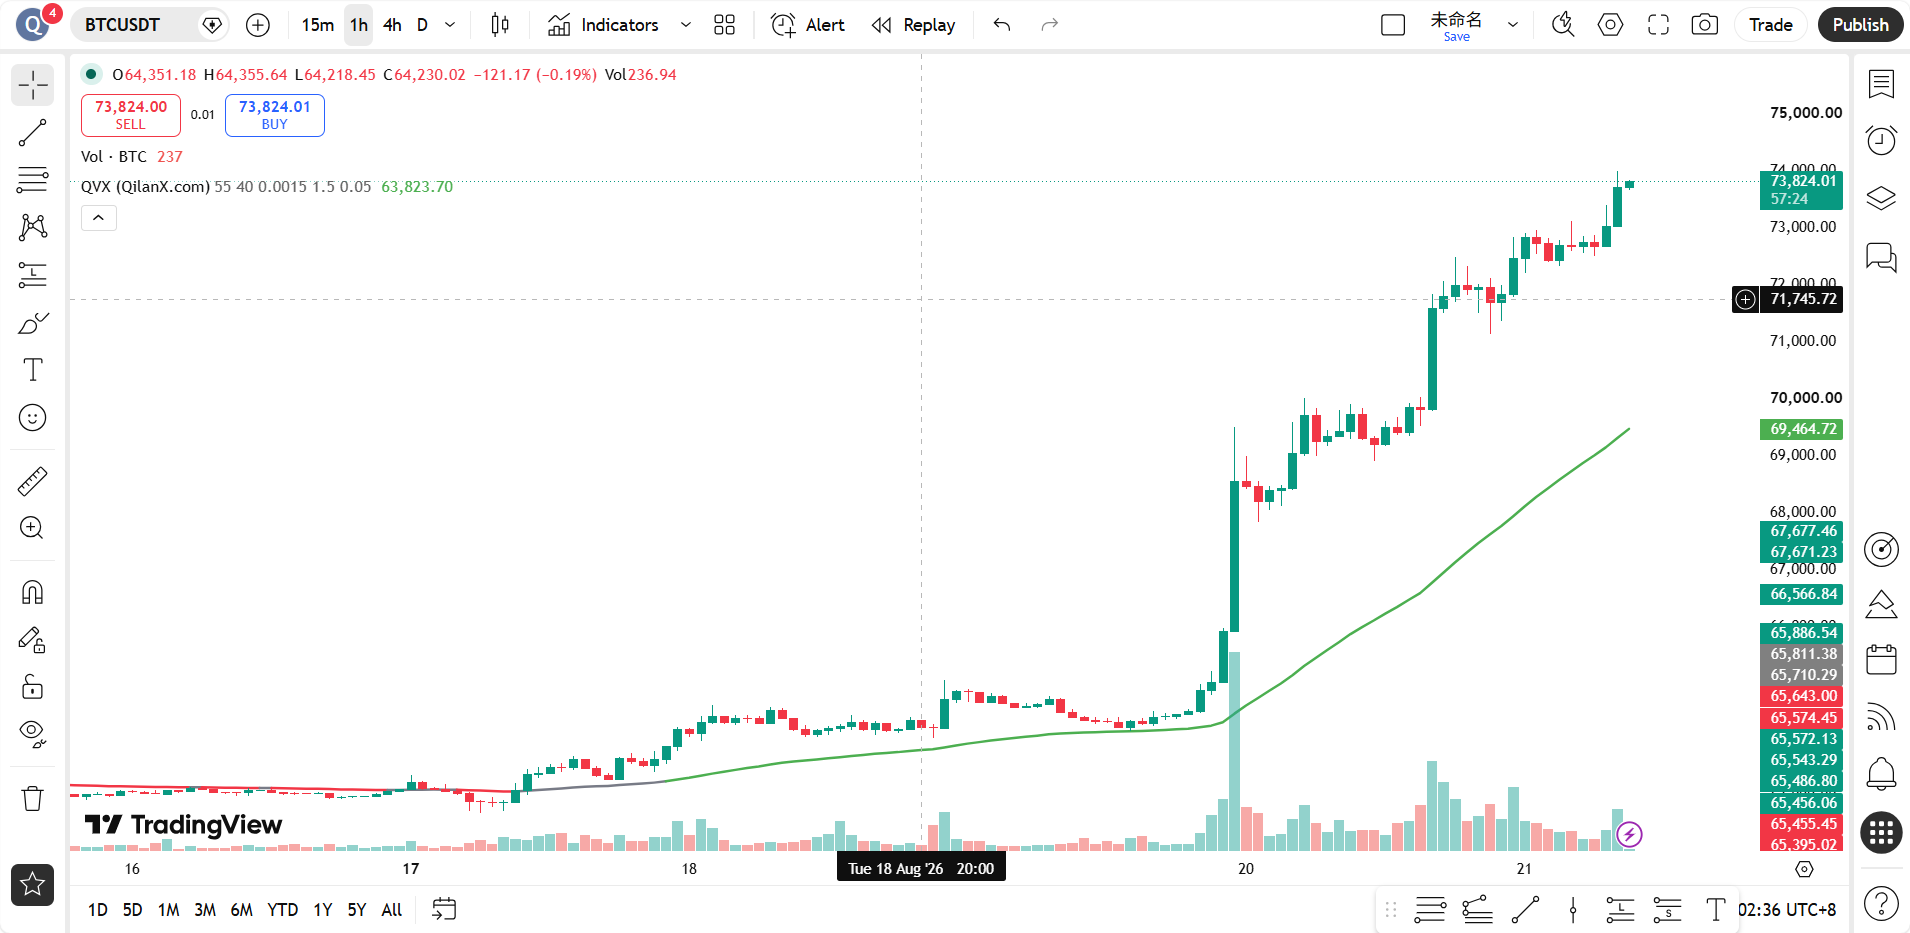
Good morning, teammates. This morning, when I opened the market, BTC directly stood at 73701, with a 24-hour increase of nearly 6%. This large bullish candle comes with considerable momentum. In terms of news, Trump publicly stated that the U.S. government is discussing a large-scale Bitcoin and crypto asset reserve plan, which is a significant policy good news that directly ignited market sentiment. Meanwhile, Standard Chartered Bank predicts that Bitcoin will hit $100,000 by the end of the year, citing the liquidity released from U.S. Treasury buybacks. These two pieces of news combined have brought an already bullish market into a state of euphoria. However, especially at times like this, it is crucial to remain calm, as there was a total liquidation of $1.772 billion across the network in 24 hours, with over 140,000 people being liquidated. After the short squeeze, leveraged funds are accumulating rapidly, and risks are rising simultaneously.
The current time is August 21, 09:01 AM, and the latest price of BTC is 73701 USDT. This level has already broken through the psychological barrier of $73,000 and is not far from the historical high area. From a short-term structural perspective, after the price completed a pullback confirmation near $73,000, it continued to advance, and bullish momentum remains strong. However, the 1-hour RSI has already reached 76.98, and the 15-minute RSI has also hit 75.33, indicating clear short-term overbought signals. Next, we need to focus on whether the price can stabilize at a high level or if there will be a quick liquidation wave.
First, looking at the daily level, MA5 is at 69065, MA10 is at 66132, and MA30 is at 64834, with the moving average system showing a standard bullish arrangement. The MACD's DIF is at 1569, DEA at 507, and histogram at 1062, with momentum continuing to amplify. The RSI is at 83.75, which is a very high reading, indicating that the daily level has already entered a strong overbought zone. This position usually means the trend is strong but also indicates that once a pullback occurs, the magnitude may not be small. At the 4-hour level, MA5 is at 72763, MA10 is at 70914, and MA30 is at 66269, with the price far from the short-term moving averages. The MACD histogram is at 690, with momentum still upward, but the RSI has reached 93.36, a very extreme value, nearly at historical high regions. At the 1-hour level, MA5 is at 73170, MA10 at 72922, and MA30 at 71267, with the price above all moving averages. However, the MACD's DIF is at 1208, DEA at 1260, and the histogram is negative at 51.86, indicating that the upward momentum at the 1-hour level has actually begun to weaken, showing slight signs of a top divergence. At the 15-minute level, MA5 is at 73662, MA10 at 73326, and MA30 at 72887, the MACD histogram is 74, and the bulls are still in control, but the RSI has entered the overbought zone.
Next, let's use the Qinglan TPV system for signal verification. First, regarding the EMA55 dividing line, the current 1-hour EMA55 is at 69517, while the price is at 73701, making the price distance from EMA55 reach 6.02%. In the past 8 1-hour candles, the closing price has been greater than EMA55 8 times, with 0 crossings, completely not meeting the oscillation threshold, currently in a clear one-sided bullish trend. According to TPV system rules, the price must close above EMA55 for 2 consecutive 1-hour candles to meet the first condition for going long. Now, looking at the support stabilization pattern, last night, after breaking through $73,000, the price pulled back slightly, touching around 72800 and then quickly rebounding, forming a 1-hour candle with a clear lower shadow, confirming an effective low point for a rebound, satisfying the second condition. Finally, in terms of weakening downward momentum, although the 1-hour MACD histogram is negative, examining earlier candle combinations shows that the price underwent a brief contraction pullback before breaking $73,000, followed by an expansion and upward attack, which is a typical initiation pattern after a volume stagnation, meeting the third condition. Therefore, from the perspective of the TPV system, the current bullish trend is established, and the long conditions are satisfied at the 1-hour level. However, it is crucial to note that both the 4-hour and daily RSIs are in extreme overbought regions, indicating that although the trend is upward, the cost-effectiveness of chasing highs is decreasing.
In terms of on-chain data, Bitcoin's market share has reached 58.87%, indicating that this round of increases is primarily driven by Bitcoin, while altcoins have seen relatively limited gains, with funds showing signs of concentrating in mainstream currencies. The 24-hour increase and decrease is 5.96%, belonging to a volume increase. Although the Fear and Greed Index is unknown, judging by the liquidation data, $1.772 billion was liquidated across the network in 24 hours, with most being short positions being liquidated, which indicates that market sentiment has tilted extremely towards bulls. Citibank plans to launch institutional Bitcoin custody services this year, and Franklin Templeton's tokenized fund has been approved for entry into traditional fund channels, all of which are long-term positives, providing compliant pathways for subsequent capital entry. However, in the short term, a major player has a $4.3 million floating profit on ETH long positions with 25x leverage, and such high-leverage operations often signal intensified volatility during extreme emotions.
In terms of critical support and resistance levels, the first resistance level above is at 74000, which is a round number and also a dense area of previous trapped positions. If it breaks through 74000, the next target will be 75000. The first support below is at 73000, which is the confirmation point after last night's breakthrough and also the short-term divide between bulls and bears. If it falls below 73000, the second support is around 72000, corresponding to the 1-hour MA10 position. Further down, 71000 is the location of the 1-hour MA30 and also the acceleration starting point for this upward move. From the perspective of the TPV system, as long as the price does not fall below the 1-hour EMA55 at 69517, the bullish trend is not damaged, but the risk of a short-term pullback is accumulating.
In terms of trading ideas, we are currently in a one-sided bullish trend, but short-term overbought is serious, so it is not recommended to chase higher directly. If the price pulls back to the range of 73000 to 72800 and forms a bottom pattern or has a long lower shadow simultaneously while the MACD histogram begins to narrow, a small long position can be taken, with a stop loss below 72400 and a target at 74000, aiming for 75000 after breaking through. If the price directly breaks through 74000 with volume and stabilizes, one can wait for a pullback confirmation before chasing long, with a stop loss at 73400 and a target between 75000 to 75500. Regarding short positions, the current trend is upward; the TPV system does not encourage counter-trend shorts unless a clear top pattern appears near 74000, and the closing price falls below EMA55, at which point a short position can be considered, with a stop loss above 74500 and a target at 72000. In terms of the oscillation range, if the price repeatedly crosses between 73000 and 74000 and the closing price of the 1-hour candles crosses EMA55 more than twice, then shift to range trading, buying high and selling low.
In terms of risk prompts, the daily RSI is 83.75 and the 4-hour RSI is 93.36, both in extreme overbought regions. If negative news emerges or largeholders take profits, a rapid pullback may occur, so make sure to control positions and set strict stop losses.
Follow Qinglan Crypto Classroom to seize more trading opportunities! Welcome to visit the official website www.qinglan.org
📊 Qinglan TPV Trading Strategy Backtest Reference
🕒 Last Backtest Time 08-21 07:00:01
Total Analysis: 3640 Backtests: 3636 Accuracy: 79.9% (2906/3636)
免责声明:本文章仅代表作者个人观点,不代表本平台的立场和观点。本文章仅供信息分享,不构成对任何人的任何投资建议。用户与作者之间的任何争议,与本平台无关。如网页中刊载的文章或图片涉及侵权,请提供相关的权利证明和身份证明发送邮件到support@aicoin.com,本平台相关工作人员将会进行核查。