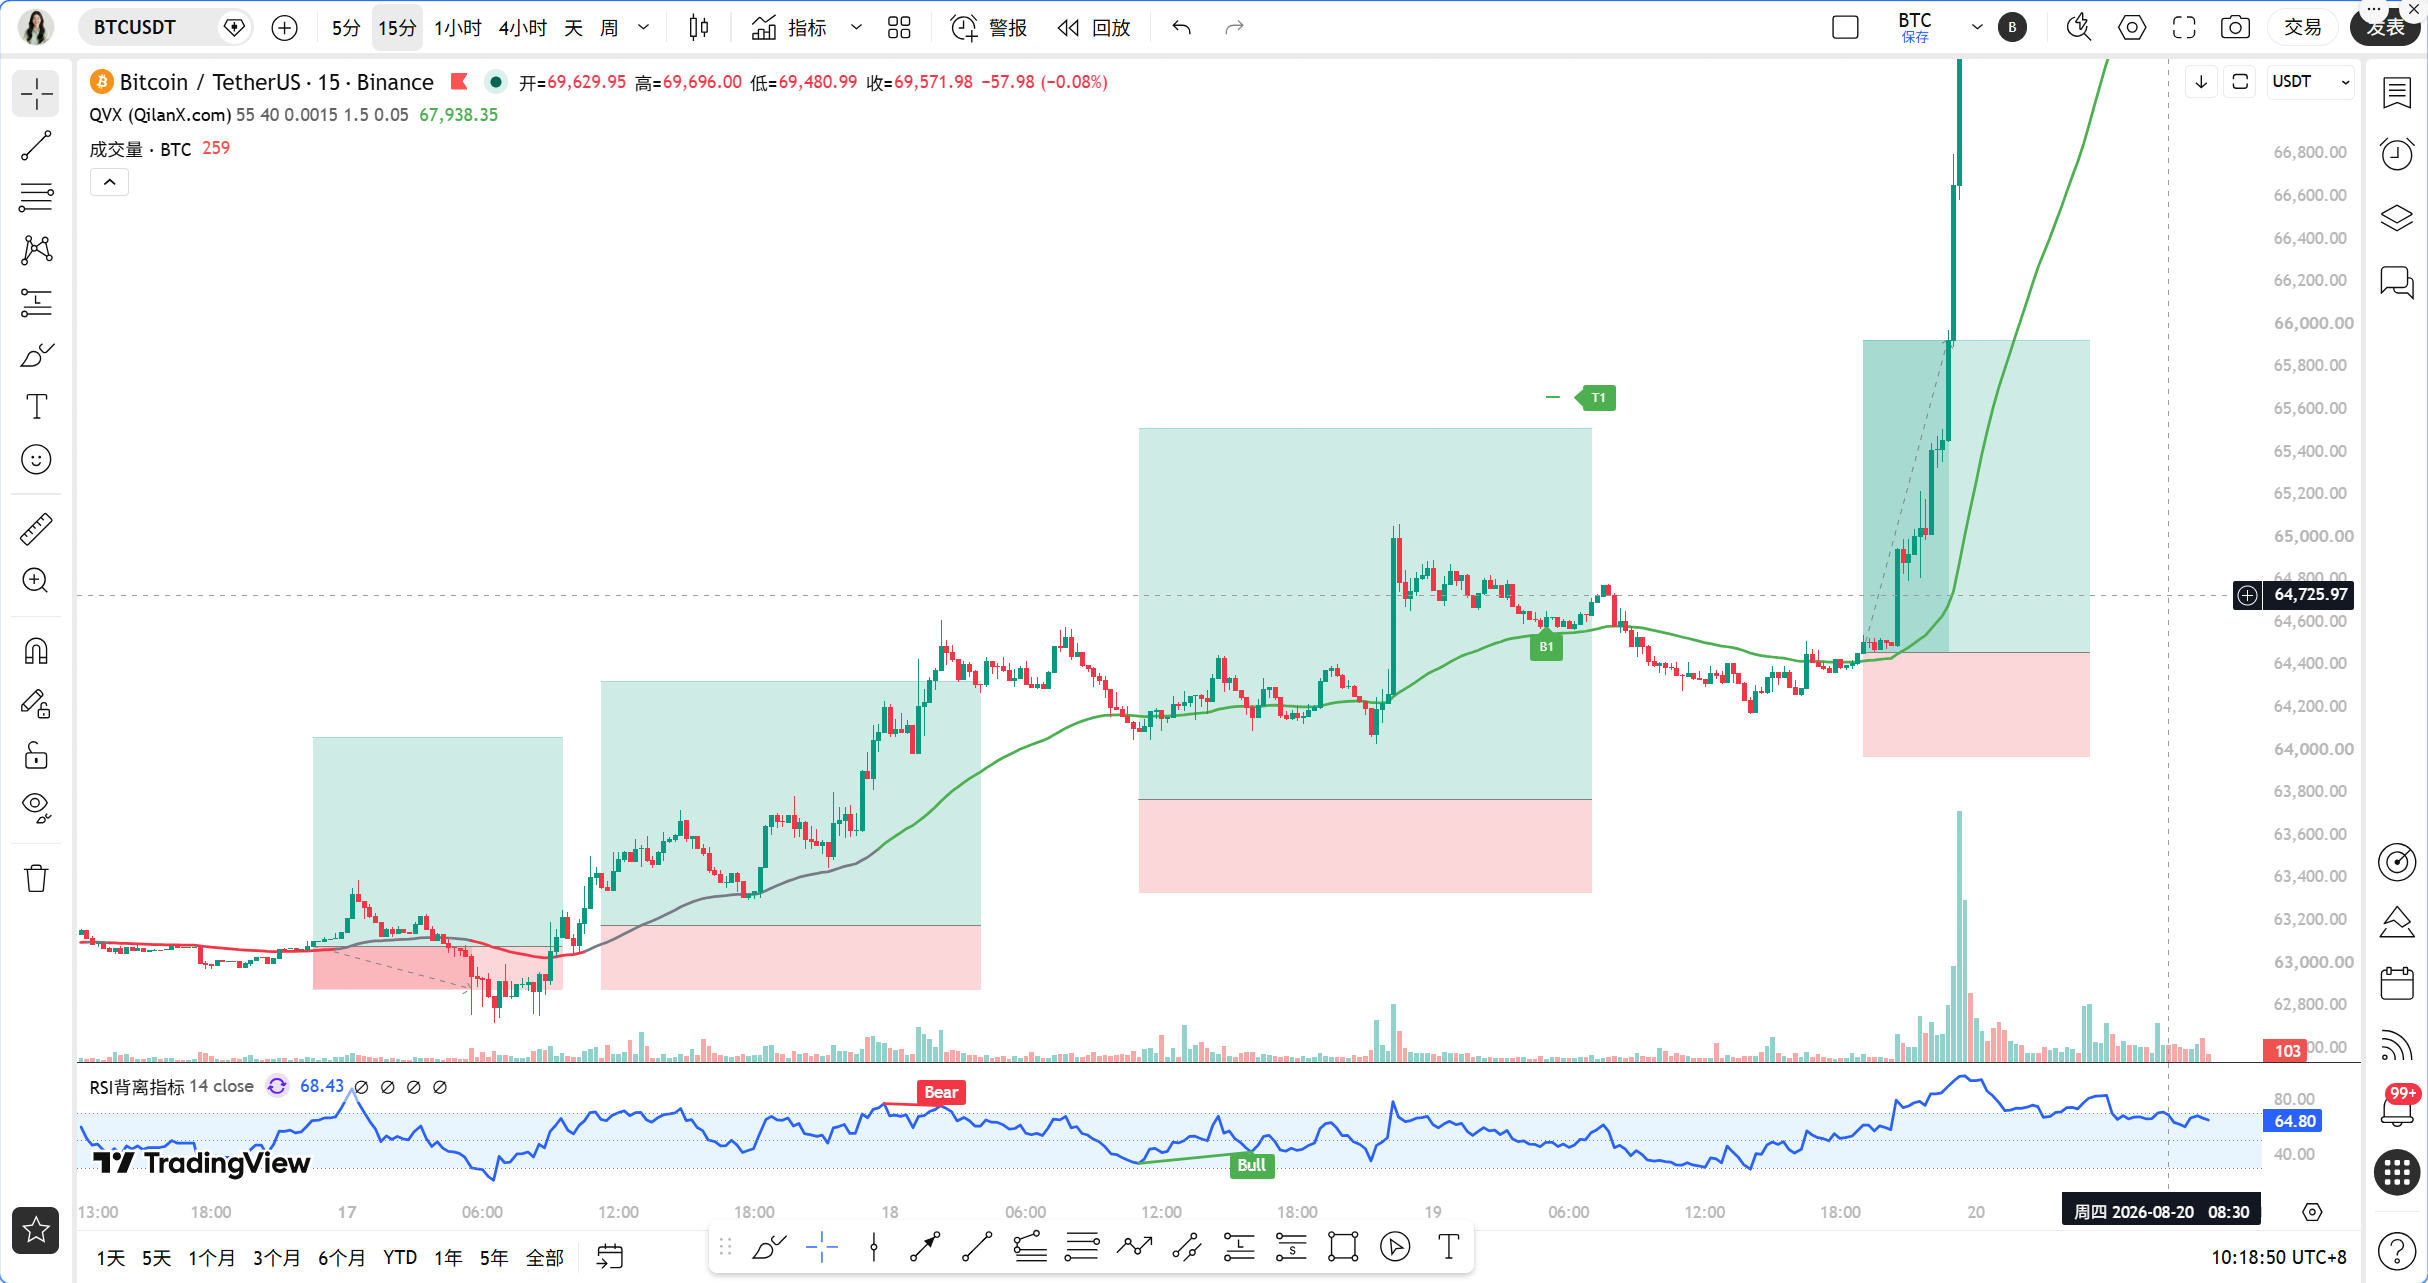
Good morning, teammates. This morning, when I opened the market, BTC approached 70,000 USDT directly, with a 24-hour increase of over 8%. More than 1 billion US dollars in short positions were liquidated, marking the largest rebound since March. On the news front, the Trump administration has pulled off significant moves, first announcing the end of the crypto war, and then revealing plans for a substantial Bitcoin reserve. Meanwhile, the SEC is advancing a proposal for exemptions on token issuance below 5 million US dollars. This series of actions has dramatically shifted market sentiment from freezing to boiling. However, at times like these, it is essential to remain calm; the 70,000 mark is not easy to surpass. Today, Qinglan will guide everyone through the market analysis.
The current time is 10:17 AM on August 20, with the latest BTC quote at 69,583 USDT, just a step away from the 70,000 mark. In the past 24 hours, the increase was 8.11%, with a market share of 56.65%. This position is very delicate; moving up brings us to a psychological barrier, while moving down leads to an area of profit-taking and short-selling counterattacks.
First, let's examine the multi-timeframe status. On the daily chart, MA5 is at 66,214, MA10 at 64,777, and MA30 at 64,466. The price has far surpassed all moving averages, with a MACD bar of 573.34, indicating very strong momentum, and an RSI of 77.71, already in the overbought zone. The 4-hour chart is even more exaggerated, with an RSI of 85.16 and a MACD bar of 583.08; bullish momentum is still accelerating, but the overbought level is quite extreme. On the hourly chart, the RSI is 85.64, the MACD bar is 173.35, MA5 is at 69,463, MA10 at 69,109, and MA30 at 66,349, with the price tracking close to MA5 upwards, indicating a bullish arrangement of short-term moving averages. On the 15-minute chart, the RSI is 62.40 and the MACD bar is negative at -58.95; short-term momentum has weakened, and the price is oscillating around MA5 and MA10, while MA30 at 69,221 forms short-term support.
Now, using the Qinglan TPV system to verify the signals. Firstly, let's look at trend positioning; the current price is 69,583, with the 1-hour EMA55 at 65,993; the price is 5.44% above EMA55. In the past 8 one-hour candles, all closing prices were above EMA55, with zero crossovers, completely failing to meet consolidation conditions. This clearly indicates a unilateral bullish trend area. In terms of bullish conditions: first, the price has consistently had multiple one-hour closing prices stabilizing above EMA55, which is fully satisfied. Second, there is no obvious pullback to a low point, as the current price is in a phase of unilateral rise, and both the 4-hour and daily levels have consecutive large bullish candles, indicating a volume breakout pattern, so the effectiveness of support is not an issue. Third, the downward momentum is exhausted; the current MACD bar at the 1-hour and 4-hour levels is positive and expanding, with the RSI running above 85, indicating that bullish momentum is still being released, with no signs of exhaustion. All three conditions are satisfied, confirming that the trend direction is safe for a bullish stance.
However, I must remind you here that the TPV system confirms the trend direction, not the timing for entry. With the 1-hour RSI at 85.64 and the 4-hour RSI at 85.16, such a level of overbought historically often comes with short-term pullback risks. It does not mean to short against the trend but suggests that chasing long positions at this point is very cost-ineffective. The better approach is to wait for the price to pull back to EMA55 or a short-term moving average consolidation area before entering.
In terms of on-chain data, the fear and greed index has not updated today, but from the market performance, it appears that market sentiment has shifted from previous panic to extreme greed. BTC's market share is at 56.65%, indicating that this rally is still being led by BTC; while ETH has also broken through 2,200 USDT with a gain of 15.09%, its market share has not changed significantly, and funds are still circulating within BTC. The US Treasury has expanded bond buybacks by 40 billion US dollars, actively suppressing long-term bond yields, which provides real liquidity benefits for risk assets. If Trump's reserve plan materializes, it would become a nationally significant incremental buying force, and this expectation will continue to support market confidence.
From a key resistance and support perspective, the first resistance above is the 70,000 USDT integer mark; this level is not only a psychological barrier but also a concentrated area for stop losses from a large number of previous short positions. The quick retreat after breaking 70,000 early this morning has already indicated the selling pressure at this level. Further up is the 72,000 to 73,000 area, which is the starting point for the declines in May, where loss positions could be heavier. The first support below is around 69,200, corresponding to the 15-minute MA30 position, and the second support is in the 68,000 to 68,300 range, which is the 4-hour MA5 position and also the confirmation zone after the breakthrough early this morning. A stronger support is near 66,000, where the 1-hour EMA55 is located; if the price recovers and stabilizes here, it would be an excellent mid-term bullish entry point.
In terms of trading strategies, Qinglan offers two plans. The first plan is to go long on a pullback, with the direction being bullish; entry conditions are to wait for the price to pull back to the 68,000 to 68,300 area while observing for a bottom formation or a long lower shadow stability signal in the 1-hour timeframe, and MACD bars starting to shorten. The stop loss should be placed below 67,500, with the initial target at 70,000 and 72,000 after a breakthrough. The second plan is to chase long after a breakout, with a bullish direction; entry conditions are to wait for the price to break through 70,000 with volume and for the 1-hour closing price to stabilize above 70,000, with the stop loss below 69,500, targeting 72,000 to 73,000. Both plans are to go long with the trend, the difference being one waits for a pullback while the other waits for a breakout. If the price oscillates between 68,000 and 70,000, then it is advisable to stay on the sidelines and avoid trading back and forth in such a position.
Risk reminder: both the 1-hour and 4-hour RSI exceeding 85 simultaneously indicate severe short-term overbought conditions, and a significant bearish bar may occur at any time to wash out positions; therefore, position management is more critical than the direction assessment.
Follow Qinglan's crypto class to seize more trading opportunities! Visit the official website www.qinglan.org
📊 Qinglan TPV Trading Strategy Backtest Reference
🕒 Last Backtest Time 08-20 07:00:02
Total Analysis: 3621 Backtest: 3615 Accuracy Rate: 79.8% (2885/3615)
免责声明:本文章仅代表作者个人观点,不代表本平台的立场和观点。本文章仅供信息分享,不构成对任何人的任何投资建议。用户与作者之间的任何争议,与本平台无关。如网页中刊载的文章或图片涉及侵权,请提供相关的权利证明和身份证明发送邮件到support@aicoin.com,本平台相关工作人员将会进行核查。