Academician from the Crypto Circle: On 8.14, Bitcoin (BTC) is experiencing fluctuations and is about to make a directional choice! Latest market analysis
Bitcoin is currently priced at 63570, neither starting a substantial rise nor undergoing a deep decline, with most people remaining on the sidelines. The market is now in a typical phase of fluctuations that test patience; do not let intraday spikes disrupt your rhythm, as chasing rises and selling lows can easily lead to losses on both sides. When the larger direction is not clearly chosen, avoid heavy bets. In a fluctuating market, it’s about patience rather than the boldness to gamble.
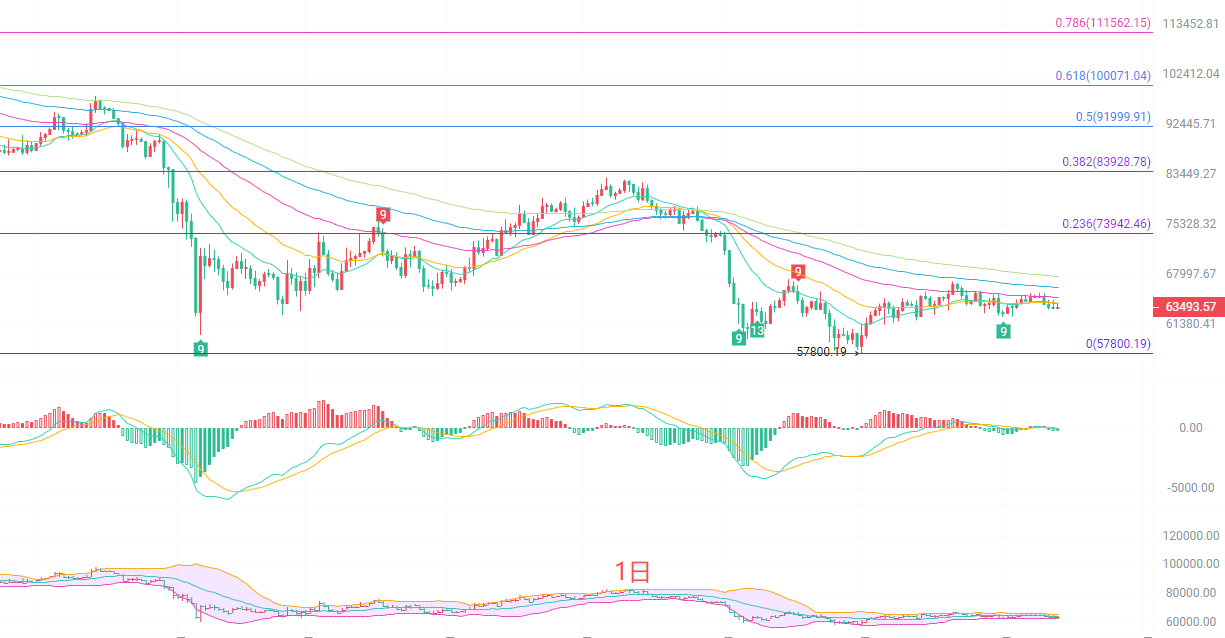
The daily K-line moving average system has all turned downward, with prices running below EMA15 and EMA30, indicating a weak short-term pattern. Key support is at 57800, and resistance is at 73942. The MACD indicator's DIF remains below the zero line, with bearish momentum somewhat converging, but no clear reversal signal has emerged. The Bollinger Bands are continuously opening downward, with prices close to the upper side of the lower Bollinger band. The larger trend at the daily level continues to belong to a phase of repair and fluctuation following a decline, with rebounds facing pressure from multiple moving averages. For the daily line to strengthen, it needs to regain a stable position above the 64000 moving average; otherwise, it will continue to face repeated downward pressure.
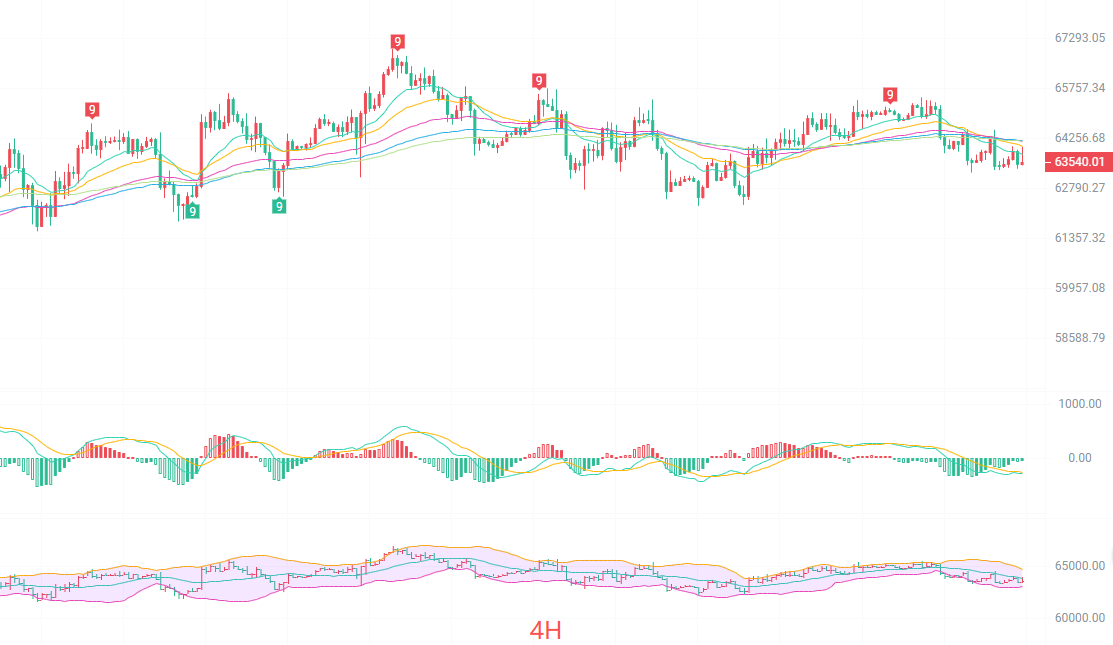
The four-hour K-line short-term moving averages are intertwined, with EMA15 and EMA30 nearly merging, indicating a balance of bullish and bearish forces. The MACD dual line continues to fluctuate back and forth near the zero line, with both bullish and bearish momentum not strong. The Bollinger Bands are currently starting to narrow, with the market entering a narrow range of fluctuations, where the upper track's resistance is at 64705 and the lower track's support is at 63068. If it does not break out of this range first, it is a typical box fluctuation trend. A breakthrough above the upper track would open up rebound space, while a drop below the lower track would test previous lows again. In the short term, there are no unilateral signals, so it is suitable for range thinking and not for chasing positions.
Short-term strategy reference:
For upwards trial positions from 63200 to 62700, stop loss at 500 points, target at 64500 to 65500.
For downwards trial positions from 65000 to 65500, stop loss at 500 points, target at 64000 to 63500.
Specific operations should be based on real-time data from the market. For more detailed information, please consult the author. The article is published with a delay and is suggested for reference only; risks are to be borne by yourself.

Warm reminder: The above content is solely created by the author of the public account. The advertisements at the end of the article and in the comment section are unrelated to the author. Please discern carefully. Thank you for reading.
免责声明:本文章仅代表作者个人观点,不代表本平台的立场和观点。本文章仅供信息分享,不构成对任何人的任何投资建议。用户与作者之间的任何争议,与本平台无关。如网页中刊载的文章或图片涉及侵权,请提供相关的权利证明和身份证明发送邮件到support@aicoin.com,本平台相关工作人员将会进行核查。