Academician of the Cryptocurrency Circle: On August 13, Bitcoin (BTC) repeatedly swept losses, this is the cruel reality of the current market! Latest market analysis
The current price of Bitcoin is 63570. The most fearful thing in cryptocurrency trading is watching the market swing back and forth. When it rises a bit, traders rush to buy, but when it falls a bit, they hurriedly sell off. Most people lose money not because they don't understand candlesticks, but because they can't withstand the temptation of market fluctuations. Recently, Bitcoin has been oscillating within a range, and many friends can't hold onto their positions, being stopped out repeatedly. The general direction has not shown a clear trend; both long and short positions have opportunities, but one must absolutely avoid reckless heavy bets.
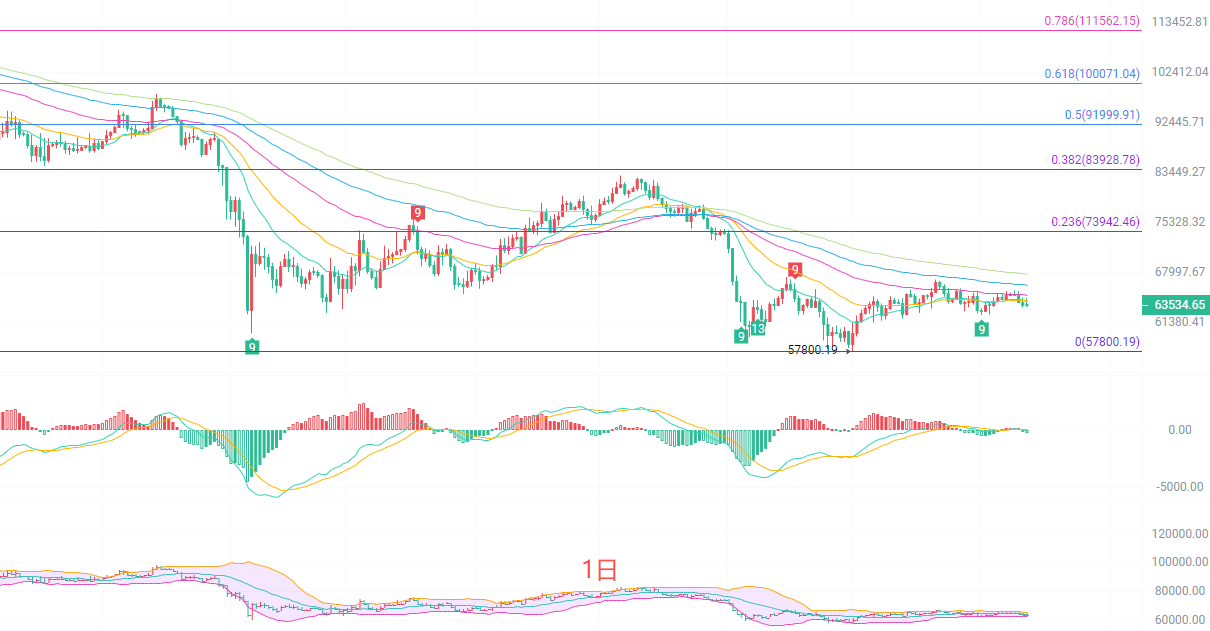
The daily candlestick is running below several EMA moving averages, with notable pressure from medium to long-term moving averages. The upper EMA30 and EMA60 are forming dual pressure. The MACD indicator's DIF and DEA are sticking together and flattening out, with weak momentum in red and green columns. The Bollinger Bands are narrowing, and the daily level has entered a volume-contracted oscillation pattern. The key support level is at the previous low of 57800, and the first resistance level above looks towards around 67300. The daily chart has not yet given a clear trend direction; it has neither strongly broken upwards to initiate a bullish trend nor effectively broken down for a deep correction. Overall, this is in a recovery phase after a big drop, and the larger cycle needs to wait for a volume increase to choose a direction; thus, chasing highs and cutting losses is not advisable.
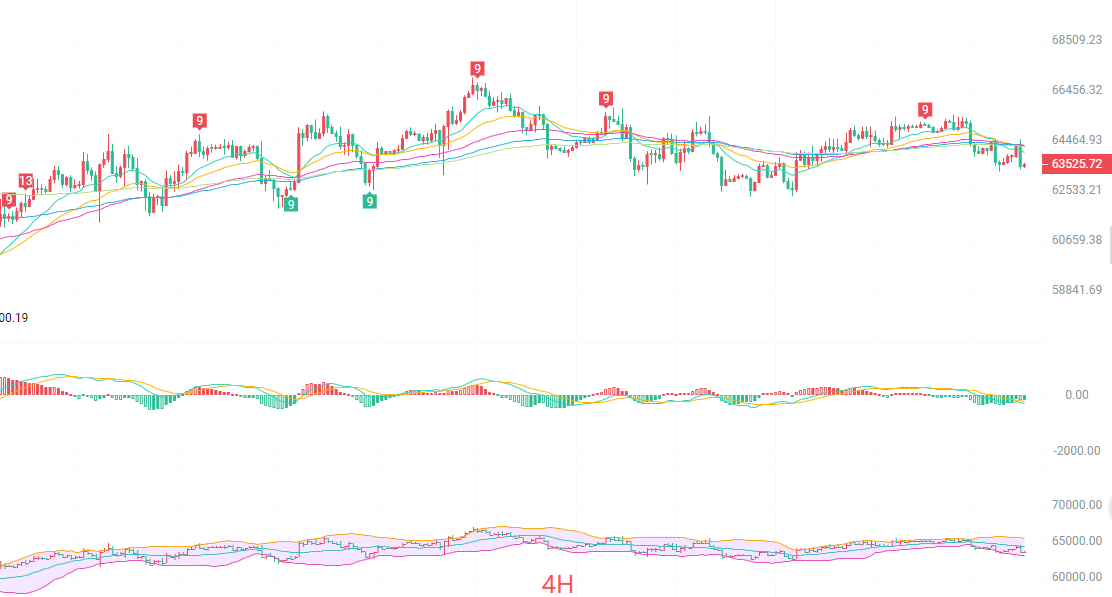
The four-hour candlestick is operating within the lower middle band of the Bollinger Bands, with the overall channel narrowing, compressing the price volatility. In the short-term, the EMA15 and EMA30 moving averages are intertwined, with both long and short forces balanced, not forming a smooth one-sided arrangement. The 4-hour MACD double lines are wrapping back and forth around the zero-axis, with alternating long and short momentum, occasionally showing false breakouts. The pressure level above is near 65500, which is the Bollinger upper band resistance position, while the support below is at 63100, the Bollinger lower band. The 4-hour chart is in a consolidation box, and the market is likely to dip and sweep losses; short-term operations must avoid chasing positions and wait for prices to approach the upper and lower edges of the box before considering layout, as the operating profit-loss ratio in intermediate positions is very poor.
Short-term trading ideas reference:
For a northward trial entry point between 63200 and 62700, stop loss at 500 points, target looking to 64500 to 65500.
For a southward trial entry point between 65000 and 65500, stop loss at 500 points, target looking to 64000 to 63500.
Specific operations should be based on real-time data from the market. For more information and details, you can consult the author. Please note that there may be delays in article publication; suggestions are for reference only, and the risk is self-borne.

Warm reminder: The above content is solely created by the author for the public account. The advertisements at the end of the article and in the comment section are unrelated to the author. Please exercise caution in identifying them. Thank you for reading.
免责声明:本文章仅代表作者个人观点,不代表本平台的立场和观点。本文章仅供信息分享,不构成对任何人的任何投资建议。用户与作者之间的任何争议,与本平台无关。如网页中刊载的文章或图片涉及侵权,请提供相关的权利证明和身份证明发送邮件到support@aicoin.com,本平台相关工作人员将会进行核查。