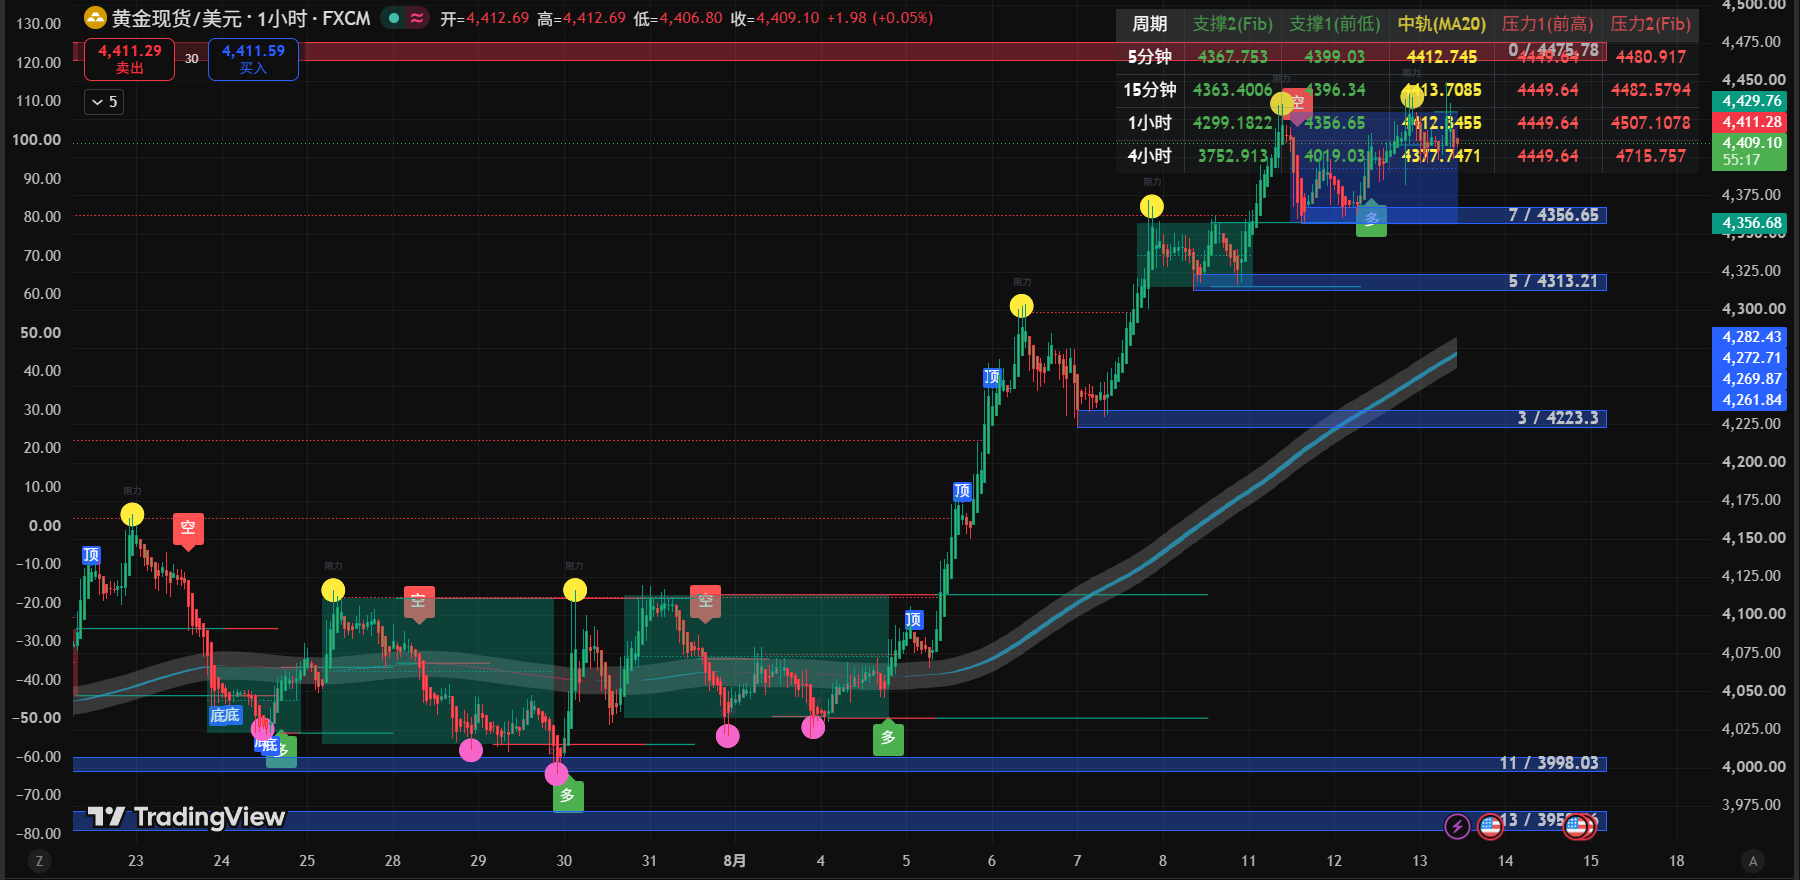
One hour K-line chart
News
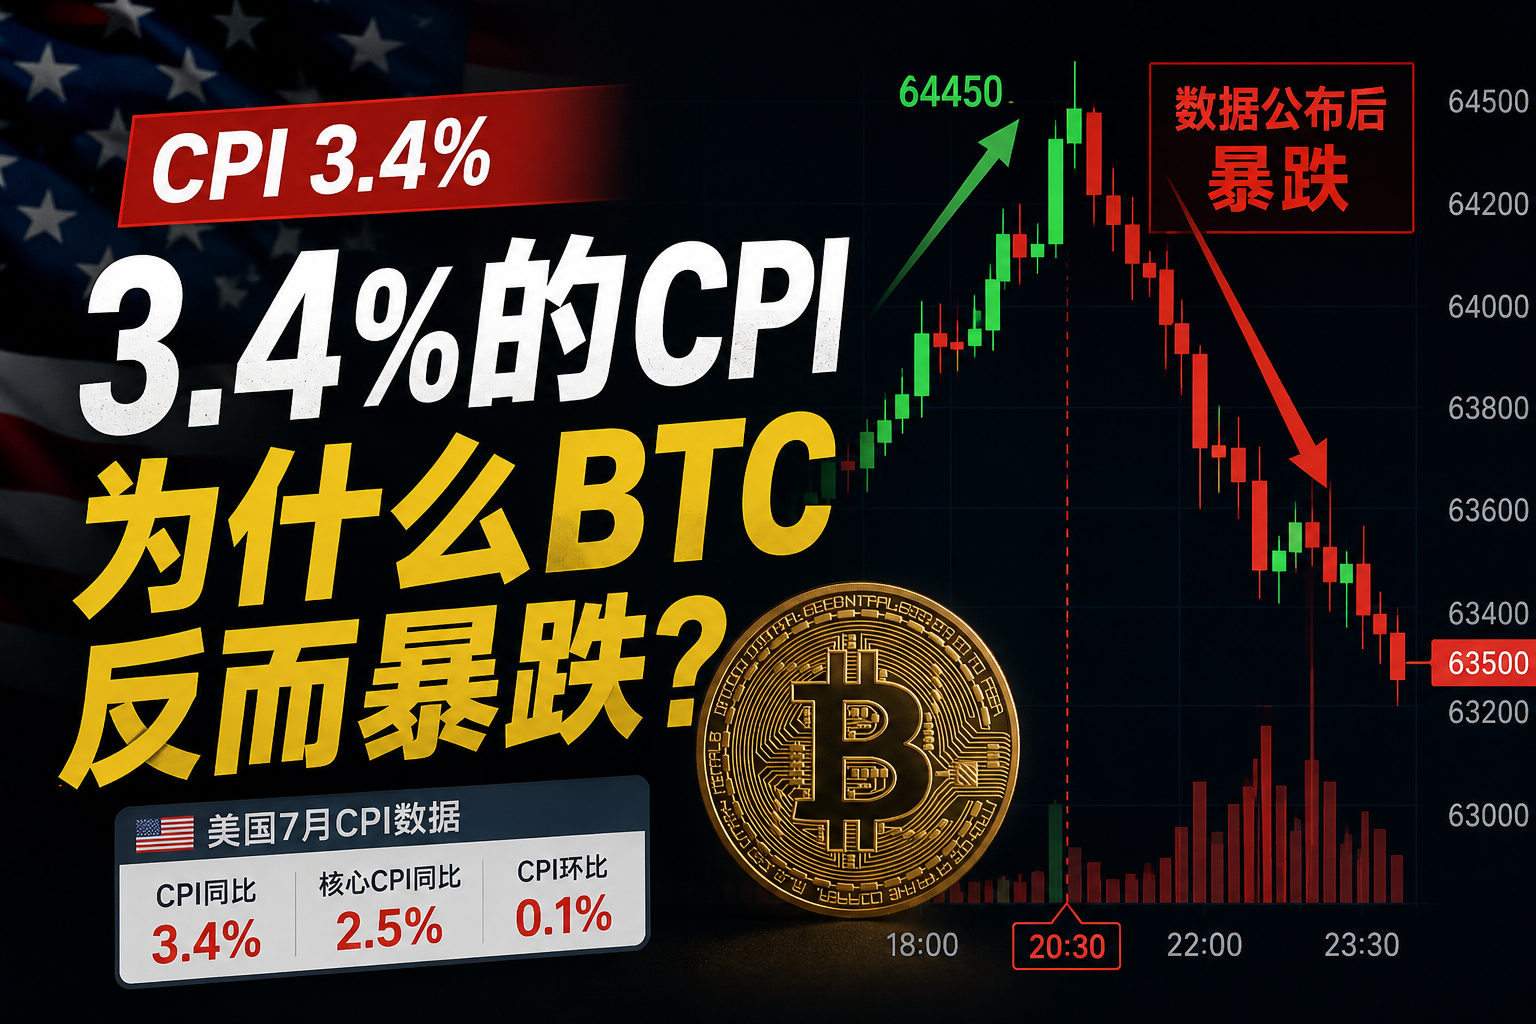
U.S. inflation data (CPI/PPI) release and interest rate cut expectations: Recent U.S. July CPI data shows a moderate decline (year-on-year 3.4%), further consolidating market expectations for a Fed rate cut in September, providing continued support for non-yielding assets like gold in the medium to long term. However, following the favorable news, some previous long positions opted to cash out at high levels, limiting short-term breakout momentum.
Safe-haven demand and geopolitical situation: The geopolitical situation remains uncertain, combined with a gentle decline in U.S. bond yields, continually supporting gold's safe-haven value, with strong buying interest at lower levels.
Large traders and institutional movements: After gold prices broke through $4400, some FOMO buying emerged, along with short covering, but at the $4450 level, significant institutional profit-taking pressure was encountered, leading to a technical pullback in prices.
Technical Analysis (1-hour level)
Price and K-line pattern: The current price is at $4406.73. In the previous phase, gold prices surged to $4449.39 along the ascending channel, creating a new high before retreating. Currently, it is consolidating in the $4400–$4415 range, showing a high-level corrective pattern.
Moving average system (MA):
MA5 (4411) and MA10 (4409) are running above the current price and turning downward, creating short-term direct pressure.
MA30 (4404) and MA52 (4397) form convergence support below, and the bullish arrangement has not been completely damaged, with the price testing the effectiveness of MA30 support.
Technical indicators:
RSI (6,13,24): RSI1 (6) is at 50.06, RSI2 (13) is at 53.16, indicating a retreat from the previously overbought area back to around the 50 midline, showing that short-term overbought pressure has been largely released, entering a neutral game between bulls and bears.
TD sequence: A TD 9/13 reversal signal appeared at the high of $4449.39, triggering a pullback. The current TD sequence count is Up 4, still in the stage of regaining momentum.
Key support and resistance levels:
First resistance level: $4412–$4415 (MA5/MA10 overlapping pressure zone)
Second resistance level: $4450 (previous high and integer level)
First support level: $4397–$4400 (MA52 and $4400 psychological level)
Second support level: $4370 (previous fluctuation platform low)
Operation direction
It is recommended to adopt a slightly bullish, key level dip-buying strategy, avoiding chasing highs and lows in the directionless area around the midline:
Trial position entry: Lightly buy in the $4398 - $4403 range (defending based on MA52 and the $4400 level).
Adding position levels: After breaking and stabilizing above $4418, add positions; or after a deep retracement and stabilization around $4375, add positions on the left side.
Take profit levels:
First take profit level: $4435 - $4440 (lock in profits in batches).
Second take profit level: $4450 - $4460 (approaching the previous high zone).
Stop loss level: Exit if effectively dropping below $4390 (disrupting the hourly rise structure).
Position management: The first trial position should be controlled at 10% - 15%, with total positions not exceeding 30%.
Risk warning
Risk of breaking key support: If the price fails to maintain above $4397 (MA52) after opening, it may trigger technical stop-loss selling, probing downward towards the $4370 support.
Countermeasure: It is strictly forbidden to hold positions without stop-loss. A decisive stop-loss should be executed if breaking below $4390, waiting for a stabilization signal below before re-establishing positions.
Evening PPI data impact: Tonight (August 13), the U.S. PPI producer price index will be released. If the data is unexpectedly strong, it may drive U.S. bond yields to rebound and suppress gold prices.
Countermeasure: Reduce positions to below 10% or push for a breakeven loss in the 15 minutes before the data release to avoid abnormal volatility at the moment of data announcement.

免责声明:本文章仅代表作者个人观点,不代表本平台的立场和观点。本文章仅供信息分享,不构成对任何人的任何投资建议。用户与作者之间的任何争议,与本平台无关。如网页中刊载的文章或图片涉及侵权,请提供相关的权利证明和身份证明发送邮件到support@aicoin.com,本平台相关工作人员将会进行核查。