Dear teammates, this morning's market has been another thrilling night. Bitcoin has directly fallen below the $64,000 threshold, causing the market panic to surge instantly. But at this moment, a significant news caught my attention: BlackRock's IBIT Bitcoin ETF has increased its holdings by 1,340 BTC in just 3 hours, worth up to $86.3 million. On one side, Strategy sold 1,690 BTC to raise 108.6 million, while Wall Street giants are frantically buying; who is really taking whose position? At the same time, the BIP-110 hard fork will be launched on September 1st, and Bitcoin's proof-of-work algorithm will undergo changes, and this uncertainty hangs over us like the sword of Damocles. Today, let’s thoroughly analyze the current market situation to see whether this drop is a trap or an opportunity.
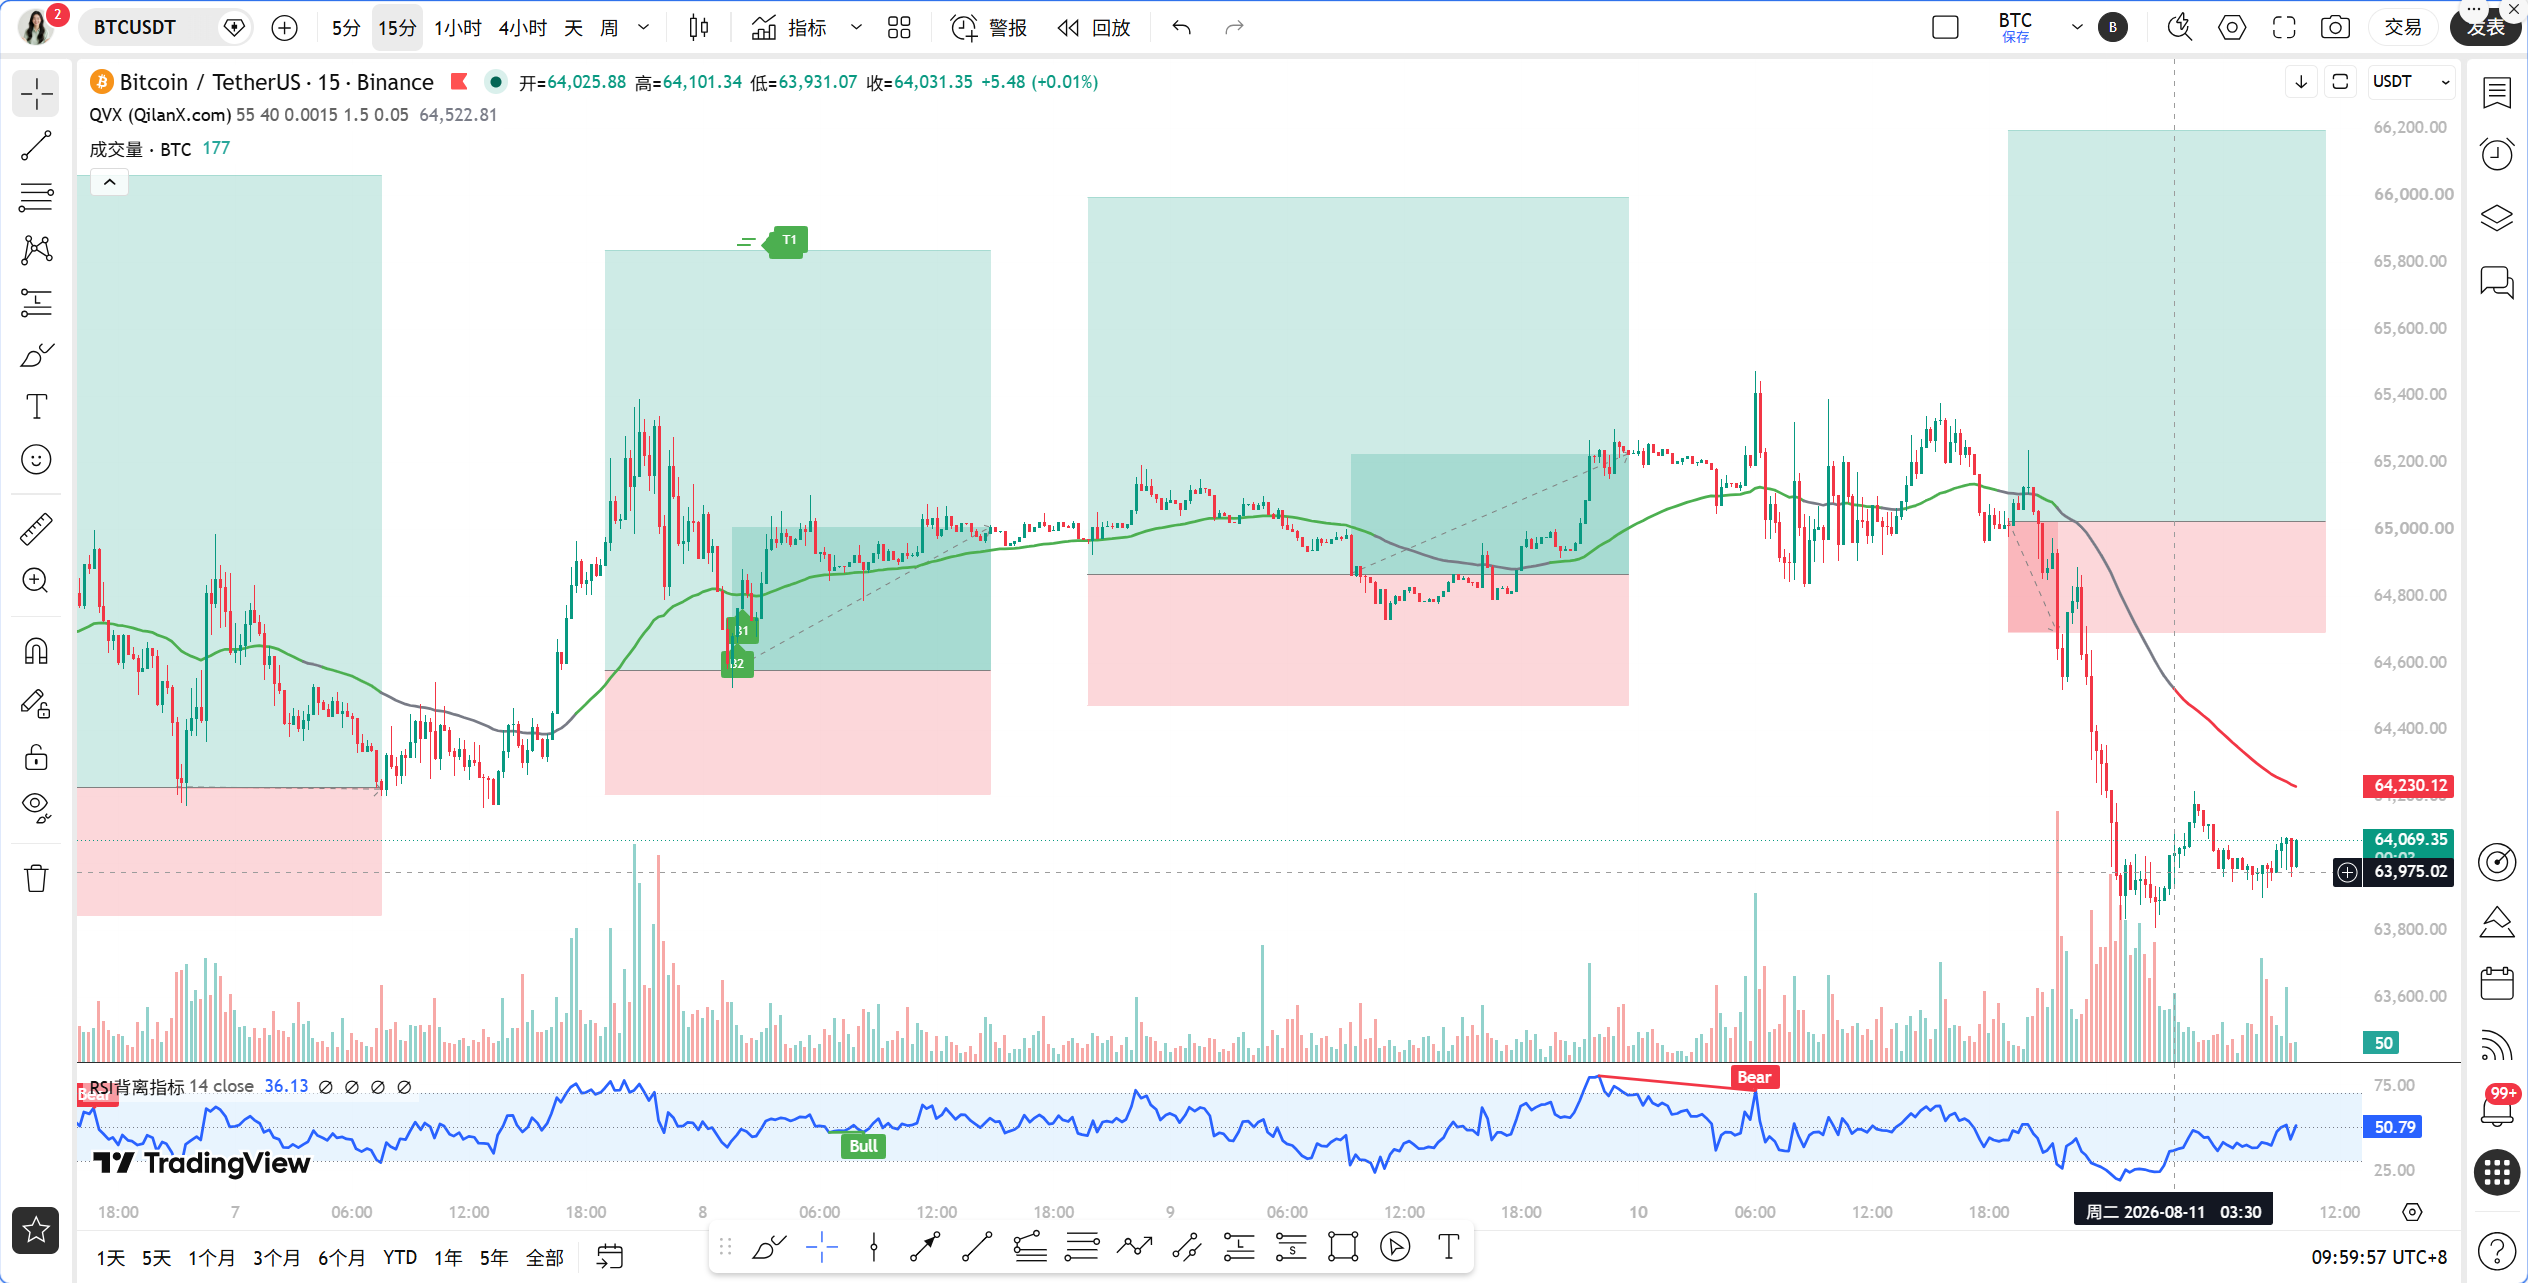
As of now, the time is August 11, 09:59, and the latest BTC quote is 64,069 USDT, with a 24-hour decline of 1.75%. The Fear and Greed Index is reported at 29, in the fear zone, indicating that market sentiment is extremely pessimistic. However, often at such times, I become more alert, as opportunities often arise from despair.
First, let’s look at the multi-period state. On the daily level, MA5 is at 64,565, MA10 is at 64,301, and MA30 is at 64,385. The three moving averages are clustered together, with the MACD histogram at only 0.54, nearly flat, and the RSI at 51.13, in a neutral position. This indicates that there is no clear direction on the daily level, just a large-scale consolidation. The 4-hour level is a bit more interesting; MA5 is at 64,302, MA10 is at 64,700, and MA30 is at 64,764, with the moving averages in a bearish arrangement. The MACD histogram is -157.20, continuing to expand, and the RSI is at 31.28, close to the oversold area. The 1-hour level is clearer, with MA30 at 64,664, EMA55 at 64,673, and the price at 64,069, well below these two moving averages. The MACD histogram is -23.59, and the RSI is at 24.55, indicating a deep oversold state. On the 15-minute level, MA5 is at 64,047, MA10 is at 64,013, MA30 is at 64,024, and the short-term moving averages are clustered, with the MACD histogram at 20.06 and the RSI at 56.26, showing some signs of stabilization.
Next, let’s use our Qinglan TPV system to verify the signals. First, looking at trend positioning, the current price is 64,069, with the 1-hour EMA55 at 64,673, indicating that the price is clearly below EMA55 and in a bearish trend zone. Next, looking at the oscillation auxiliary data, in the past 8 hourly candles, the closing price above EMA55 occurred 0 times, with 0 crossovers; the current price is 0.93% away from EMA55, not meeting the oscillation threshold, indicating we are in a one-sided declining trend. According to TPV system rules, in a bearish trend, we only consider shorting conditions. Shorting requires three conditions to be met simultaneously: First, the price is under pressure below the 1H EMA55, with two consecutive hourly candles closing below EMA55; this condition is met. Second, to encounter resistance, we need to see long upper wicks, double tops, or retreat after reaching effective highs, but the current price is a low point after a rapid decline and shows no significant resistance pattern. Third, weakness in rebounds, with the MACD histogram shortening for two consecutive periods or RSI falling from above 70, but the current RSI has dropped to 24.55, indicating an oversold state, and a rebound could happen at any time. Therefore, although the trend is bearish, the risk-reward ratio for chasing shorts is not ideal, and I do not recommend shorting at this position.
On the on-chain data side, BlackRock's increase in holdings is the biggest highlight. The purchase amount of 1,340 BTC indicates that institutions are accumulating during this drop. On the other hand, MARA sold 23,000 BTC in the first half of the year, cashing out $1.6 billion, and miner selling pressure still exists. Tether has issued 1 billion USDT on the Tron network, injecting liquidity into the market, which is a relatively favorable signal. Overall, this is currently a stage of competition between institutional accumulation and miner selling; short-term supply pressure still exists, but expectations for long-term capital inflow are also strengthening.
The key attack and defense points: the first resistance point above is at 64,670, which is the position of the 1-hour EMA55. This position is the watershed between bulls and bears; if it can hold steady, the short-term bearish trend may be reversed. The second resistance point is at the 65,000 integer level, which is the position of the 4-hour MA10. The first support point below is at 63,800, which is a previous low point of support, and the second support point is at 63,000, which is a psychological integer level and also near the MA30 on the daily level.
For trading strategies, I present two plans. The first plan, aggressive players can attempt to take a rebound. Entry conditions: wait for a bullish engulfing pattern or a long lower wick stabilization signal on the 1-hour level, while the MACD histogram shows two consecutive periods of shortening; a light position can be tried near 64,000, with a stop loss at 63,600 and a target at 64,670, breaking out thereafter to aim for 65,000. The second plan, for conservative players, is to wait for the price to rebound to around 64,670. If a double top or a long upper wick appears along with a shortening MACD histogram, entry can be made for a short, with a stop loss at 65,050 and a target at 63,800, breaking thereafter to aim for 63,000. Here, I want to remind you that the current 1-hour RSI has dropped to 24.55, indicating deep oversold conditions, so a technical rebound could occur at any time. Therefore, the risk of pursuing shorts is very high; I prefer to wait for shorting opportunities after a rebound, or short-term long opportunities after stabilization at low levels.
Risk warning: The uncertainty brought by the BIP-110 hard fork may lead to market volatility, so please strictly control your position and take necessary risk precautions.
Follow Qinglan Crypto Class for more trading opportunities! Welcome to visit the official website www.qinglan.org
📊 Qinglan TPV trading strategy backtest reference
🕒 Last backtest time 08-11 07:00:02
Total analysis: 3481 Backtests: 3471 Accuracy: 80.7% (2801/3471)
免责声明:本文章仅代表作者个人观点,不代表本平台的立场和观点。本文章仅供信息分享,不构成对任何人的任何投资建议。用户与作者之间的任何争议,与本平台无关。如网页中刊载的文章或图片涉及侵权,请提供相关的权利证明和身份证明发送邮件到[email protected],本平台相关工作人员将会进行核查。