Dear teammates, this morning's news can be described as a tale of ice and fire. On one side, BlackRock increased its holdings by 7,320 bitcoins in a single week, valued at $478.5 million, while on the other side, whales have quietly accumulated 38,000 BTC over the past two weeks. When viewing these two pieces of information together, the signal becomes very clear: institutions and large holders are taking advantage of the market's fear sentiment to build positions. At the same time, the shocking non-farm payroll data has led to a significant drop in the expectation of a rate hike in September, and expectations for liquidity easing are injecting new upward momentum into BTC. While retail investors are hesitating in the panic zone of the fear and greed index at 30, smart money is already voting with real capital. In today's article, Sister Qinglan will take everyone through a thorough breakdown of the current market using the TPV system.
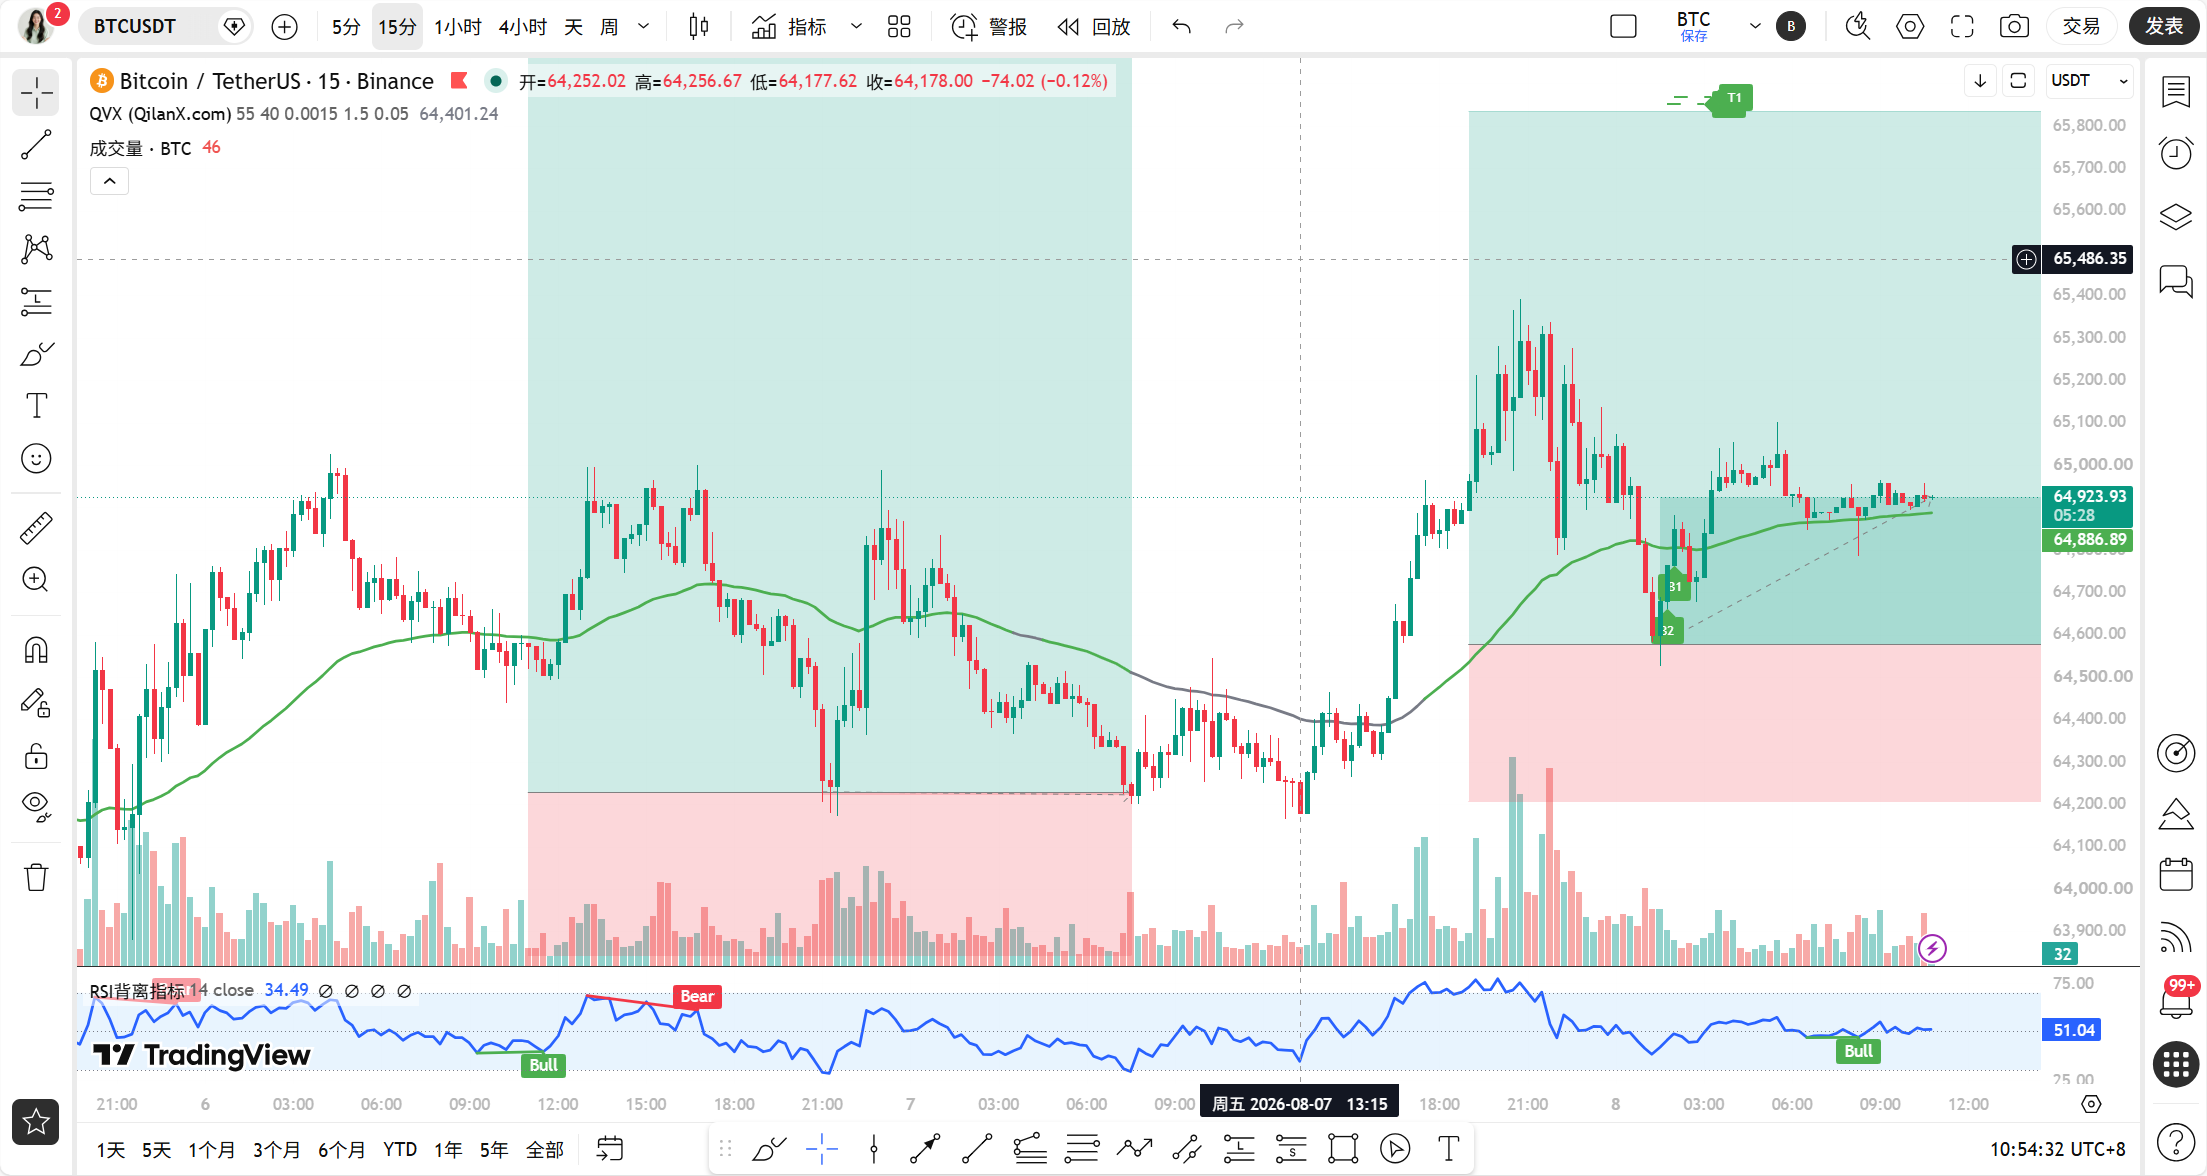
As of August 8, 10:55 AM, BTC is priced at 64,924 USDT, with a 24-hour increase of 0.91%. The price is firmly above the 1-hour EMA55, while the daily level also maintains a bullish structure. This position is delicate; a breakout upwards could lead to a whole new territory, while a drop below could trigger a new wave of panic selling.
First, let's look at the long-term cycle. The daily MACD histogram remains in the positive zone at 69.30, with the DIF line at 122.63 operating above the DEA line at 53.32, indicating that the bullish trend structure has not been damaged. The MA5 is at 64,588, MA10 at 64,052, and MA30 at 64,344, with short-term moving averages already forming a bullish arrangement, indicating that the medium-term trend at the daily level is tilting towards the bulls. The 4-hour MACD histogram at 17.98 is also in the positive zone, with the DIF line at 278.91 above the DEA line at 260.92, and the bullish momentum at this level is still being released. The RSI is around 52, indicating neither overbought nor oversold, which belongs to a healthy bullish recovery range.
Now looking at the 1-hour level, a signal that requires caution has appeared. The MACD histogram shows a negative value of 6.68, with the DIF line at 87.68 having crossed below the DEA line at 94.36, indicating that the short-term momentum at the 1-hour level is weakening. The RSI reports 30.56, having already touched the edge of the oversold area. However, note that the price of 64,924 remains above the 1-hour EMA55 at 64,680, and in the past eight 1-hour candlesticks, the closing price has been greater than EMA55 in all eight instances, with crossings at zero, which means the short-term trend is still firmly held by the bulls. The 15-minute MACD histogram at 0.33 shows the DIF line at 2.65 above the DEA line at 2.32, with the RSI around 56, indicating signs of stabilization and a rebound in the short term.
Using the Qinglan TPV system to validate the current signals. First, the trend positioning is very clear, the current price of 64,924 is above the 1-hour EMA55 at 64,680, and all previous eight candlesticks have closed above EMA55 with zero crossings, completely matching the definition of the bullish trend zone and not falling within a choppy market. Second, for long conditions, the price has consecutively closed above EMA55 in multiple 1-hour candlesticks, satisfying condition one. In terms of strong support, the 4-hour MA10 near 64,676 provides effective support, and the price has rapidly recovered after testing the range of 64,600 to 64,700 multiple times, forming an effective low point rebound structure, satisfying condition two. Third, regarding the exhaustion of the downward momentum, the 1-hour RSI has dropped to the oversold area of 30.56, and although the MACD histogram is still negative, the 15-minute MACD histogram has started turning green, indicating that the short-term selling pressure is weakening, satisfying condition three. In summary, the signal given by the TPV system leans towards bullish, but a confirmation signal of continuous shortening in the 1-hour MACD histogram is needed.
On-chain data shows that the fear and greed index is at 30, and market sentiment remains in the fear zone, which is often a characteristic of a mid-term bottom. The BTC market share is 56.78%, indicating that funds are still concentrating towards BTC. BlackRock's single-week increase of 7,320 BTC, combined with the whales' accumulation of 38,000 over two weeks, means that most of these holdings have entered cold wallets or custodial accounts, resulting in a decrease in actual circulation. European Capital B has increased its BTC reserves to 3,140 BTC, and BNY Mellon has increased its strategy stock to $102.4 million, indicating a collective demand for allocation from traditional financial institutions. Although the selling pressure from ETH whales and HYPE project parties cashing out is bringing some pressure, the supply-demand pattern for BTC itself is clearly improving.
Regarding key attack and defense positions, the first resistance level above is in the range of 65,200 to 65,400, which is the lower edge of the previous dense trading area and also where the 4-hour MA5 is located. Breaking this position, the next target directly looks towards the psychological level of 66,000. The first support level below is at 64,680, which is where the 1-hour EMA55 is located; if this position is lost, the second support level is in the range of 64,200 to 64,300, corresponding to the overlapping area of the 4-hour MA30 and daily MA30. If 64,200 cannot be held, the bullish logic needs to be reassessed.
In terms of trading strategy, Sister Qinglan provides a clear plan. The direction is bullish, but we need to wait for confirmation signals. There are two scenarios for entry conditions. The first is aggressive, where a small long position can be tested near the current price of 64,900, but the precondition is that the 15-minute MACD histogram must continuously expand and the RSI must be above 60. The second is conservative, waiting for the price to retrace to the range of 64,680 to 64,750, stabilizing near the 1-hour EMA55 before entering, with confirmation signals being a long lower shadow line or bottoming structure appearing at the 1-hour level. The stop loss position is uniformly set below 64,200, which is the lower edge of the overlapping area of the daily MA30 and 4-hour MA30; if this level is broken, it indicates that the bullish logic has completely failed. The first target level is 65,200, and the second target is 66,000; if 66,000 is broken and stabilized, it can be held to aim for 67,000. In terms of position management, keep individual risk to 1% to 2% of the total account funds; do not blindly heavy position due to positive news.
Regarding risk warnings, the 1-hour MACD histogram is still in the negative zone, and there is a possibility of a retracement to 64,680 or even 64,300 in the short term, so be cautious when chasing longs and ensure to wait for entry signal confirmation.
Follow Qinglan's Crypto Classroom to seize more trading opportunities! Welcome to visit the official website www.qinglan.org
📊 Qinglan TPV Trading Strategy Backtest Reference
🕒 Last Backtest Time 08-08 07:00:02
Total Analysis: 3433 Backtests: 3430 Accuracy Rate: 81.5% (2795/3430)
免责声明:本文章仅代表作者个人观点,不代表本平台的立场和观点。本文章仅供信息分享,不构成对任何人的任何投资建议。用户与作者之间的任何争议,与本平台无关。如网页中刊载的文章或图片涉及侵权,请提供相关的权利证明和身份证明发送邮件到support@aicoin.com,本平台相关工作人员将会进行核查。