Academician of the Cryptocurrency Circle: On August 11, Bitcoin (BTC) experienced volatility that wore down most people. Is the real game just beginning? Latest market analysis and operational advice explained
Bitcoin is currently priced at 65,200. In a volatile market, the greatest drain is often not on capital, but on human patience. Many friends watch the price move back and forth, wanting to participate in every fluctuation, resulting in frequent liquidations and gradual erosion of capital. The market does not always provide comfortable trading opportunities; when you don't understand, staying in cash and observing is also a form of trading. There is no need to rush to predict whether the breakout will be upward or downward; we should respond to signals as they come. In the cryptocurrency circle, surviving long-term is far more important than making quick money in the short term. Protect your positions, set your stop losses well, and quietly wait for the market to define its direction.
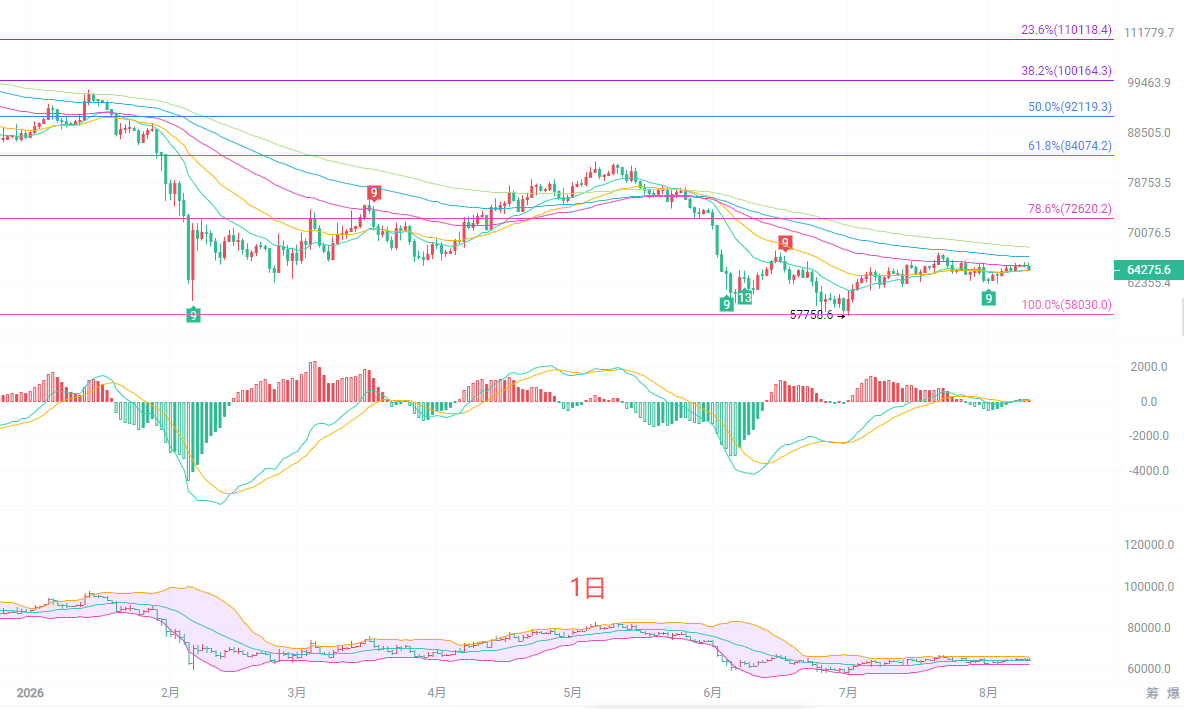
The daily candlestick chart is operating near the middle band of the Bollinger Bands, overall in a stage of low-level rebound and volatility repair. The EMA moving average system has begun to flatten out gradually, with short-term moving averages intertwining, showing a relatively balanced power between bulls and bears. The MACD indicator's DIF and DEA are sticking near the zero axis, with red and green bars continuously shrinking, and there is no clear unilateral direction on the daily level. The key support below is at 58,030, which is the low point of this round of decline, while the important resistance above is looking towards 72,620. Before an effective breakout above the resistance level on the daily level, the overall trend is still defined as a rebound and volatility, without a clear trending market. Operationally, it is advisable not to chase heights or cut losses indiscriminately, but to treat it as a range and wait for the price to choose a direction.
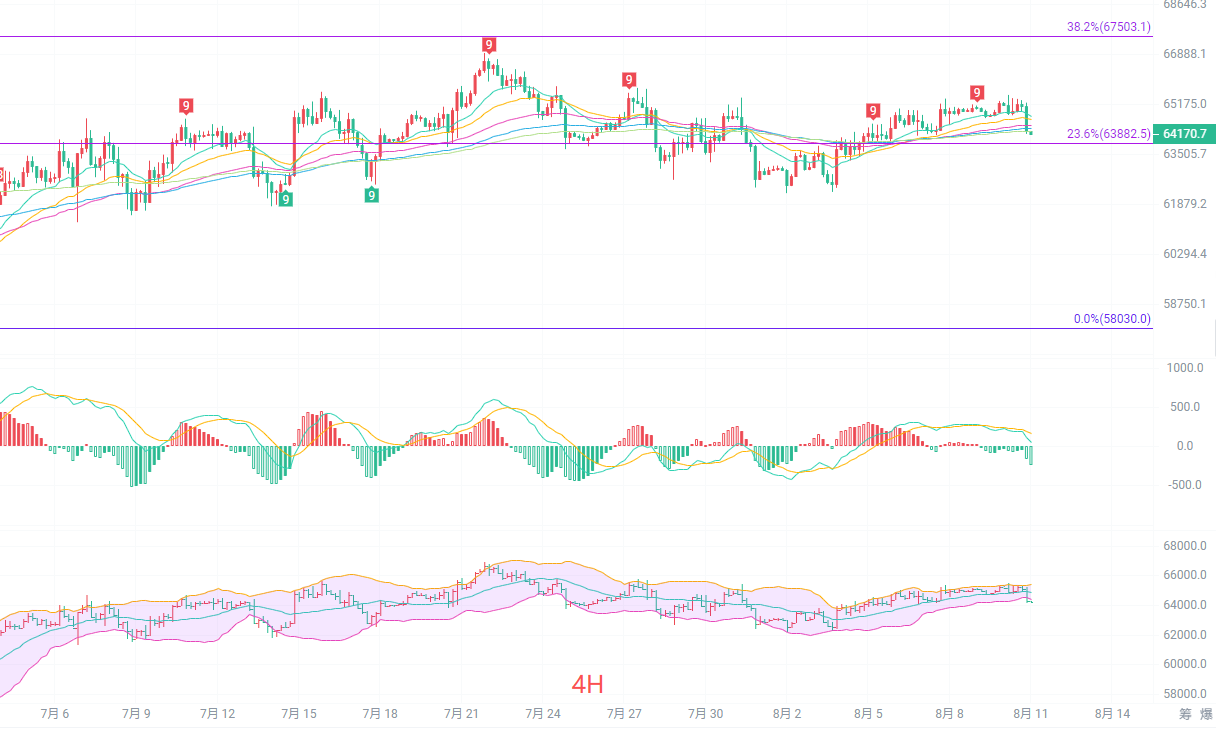
The four-hour candlestick chart is stabilizing above multiple EMA moving averages, with the moving averages gathering and forming a typical box volatility pattern. The Fibonacci 23.6% position at 63,882 has become an important short-term support, with the price repeatedly retracing to this position to find support. The Bollinger Bands have narrowed, and the amplitude of market fluctuations is continuously reducing, indicating that a major trend change is brewing. The MACD indicator's red bars are continuously diminishing, indicating that the bullish momentum is gradually weakening, and upward attacks lack strength. The short-term resistance above is at 67,503; if it cannot break through effectively, the market will likely continue to oscillate back and forth within the box. The four-hour period is suitable for high selling and low buying, not for chasing singles; wait for signals at support and resistance levels before making arrangements.
Short-term reference:
If the price does not break below 64,000 to 63,500, aim upwards; stop loss at 63,000, target at 65,500 to 67,500.
If the price does not break above 67,000 to 67,500, aim downwards; stop loss at 68,000, target at 66,000 to 65,000.
Specific operations should mainly depend on real-time data at the market; more detailed information can be consulted from the author. The publication of the article has a time delay, suggestions are for reference only, and risk is borne by individuals.

Kind reminder: The above content is solely created by the author of this public account. The advertisements at the end of the article and in the comment section are unrelated to the author. Please discern carefully. Thank you for reading.
免责声明:本文章仅代表作者个人观点,不代表本平台的立场和观点。本文章仅供信息分享,不构成对任何人的任何投资建议。用户与作者之间的任何争议,与本平台无关。如网页中刊载的文章或图片涉及侵权,请提供相关的权利证明和身份证明发送邮件到support@aicoin.com,本平台相关工作人员将会进行核查。