Crypto Circle Academician: On July 8, 8.7 Ethereum (ETH) discards subjective judgment, grasping Ethereum trading rhythm from a technical structure? Latest market analysis reference
The current price of Ethereum is 1910, with the market pulling emotions back and forth. Many people always think about catching a big market trend in one go, but ignore that the consolidation phase tests patience the most. Now, it keeps fluctuating around 1910, and the big trend hasn’t shown a clear unilateral direction. Buying high can easily lead to being trapped, and bottom fishing is risky. Do not always fantasize about getting rich overnight; most profits come from patiently waiting for the right position. Do not let short-term candlestick fluctuations disrupt your rhythm; understanding the market structure and strictly managing risks is much more important than frequent trading. Keeping a steady mindset in a fluctuating market is key to surviving.
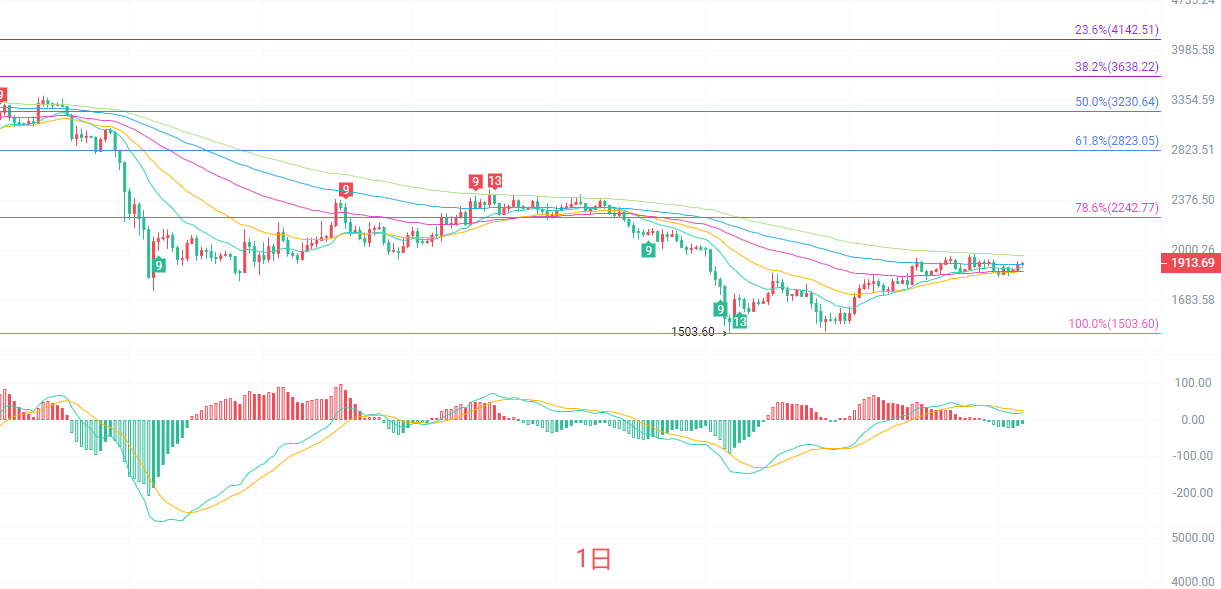
After the recent rebound, the daily candlestick price is running below multiple EMA moving averages. The mid to long-term moving averages are still downward, and the large-scale market remains in a post-decline recovery phase. The MACD indicator is below the zero axis, with a slight increase in red bars, indicating that bullish momentum is somewhat recovering, but hasn’t formed a strong reversal signal. The Bollinger Bands have narrowed openings, and the price is running below the middle band; strong resistance above is at the 2242 Fibonacci 78.6% position, while support below looks towards 1833, which is the lower band. On the daily timeframe, this is a consolidation after a large decline, and it hasn’t completely reversed the bearish big picture. The rebound is more about market recovery, and should not be directly viewed as a reversal, as the heavy moving average resistance above will limit the upward space.
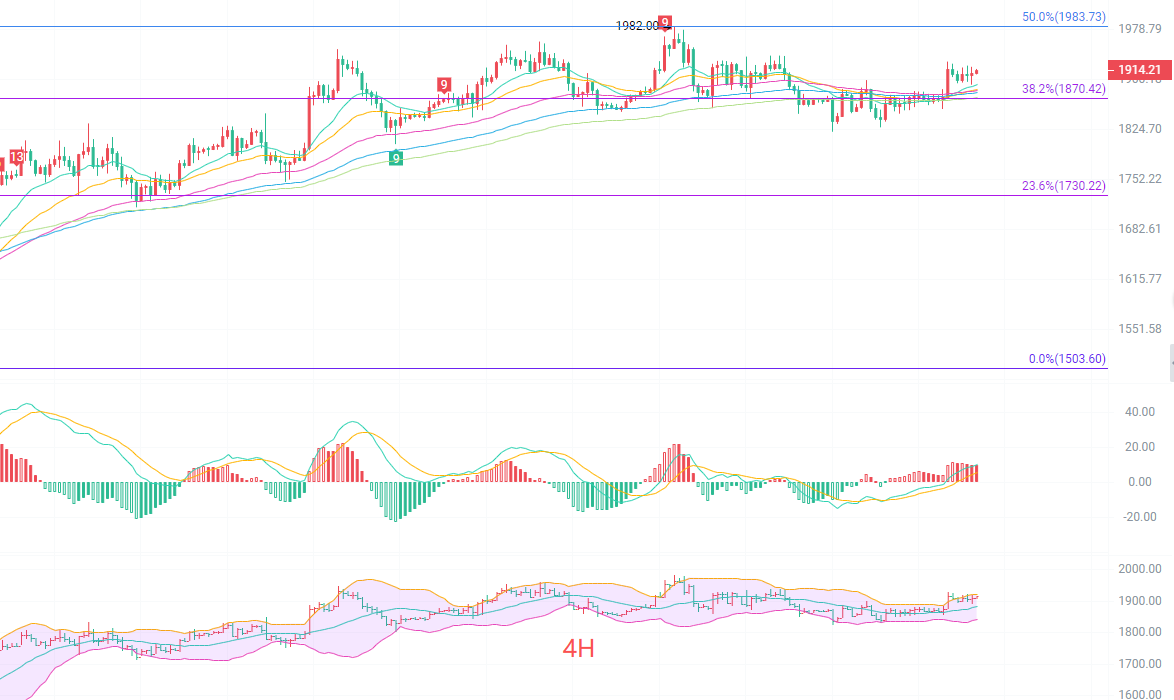
The four-hour candlestick has stabilized above the short-term EMA moving averages, with the moving average system turning upward, leading to a low-level rebound pattern. The MACD is running above the zero axis, with DIF and DEA maintaining a bullish arrangement, while the volume of red bars is released mildly, giving short-term bulls the advantage. The Bollinger Bands channel is opening upward, and the price is close to the upper band. Strong resistance above is at 1983, which is also the 50% Fibonacci retracement level, with multiple tests of this position causing retraction. Support below is around 1870 at the 38.2% retracement level, which is also key support for the four-hour timeframe. The four-hour level represents a short-term bullish recovery market, but the resistance range above is very close, making it easy to encounter selling pressure when pushing higher. This is risky for direct buy positions; it is more suitable to wait for a pullback to support for layout.
Short-term reference:
Do not break below 1870 to 1820 for northbound, stop loss at 1790, target at 1900 to 1930.
Do not break above 1980 to 2010 for southbound, stop loss at 2050, target at 1860 to 1820.
Specific operations should rely on real-time market data; for more information details, you can consult the author. The article is published with some delay, suggested for reference only, and risks are self-borne.

Warm reminder: The above content is solely created by the author on the official account. Advertisements at the end of the article and in the comments section have no relation to the author. Please discern carefully, and thank you for reading.
免责声明:本文章仅代表作者个人观点,不代表本平台的立场和观点。本文章仅供信息分享,不构成对任何人的任何投资建议。用户与作者之间的任何争议,与本平台无关。如网页中刊载的文章或图片涉及侵权,请提供相关的权利证明和身份证明发送邮件到support@aicoin.com,本平台相关工作人员将会进行核查。