Cryptocurrency Academy: 8.7 Bitcoin (BTC) fluctuates and consumes market patience, how to penetrate the surface and capture market-changing signals? Latest market analysis and operational advice explanation
Bitcoin's current price is 64700, and there is no clear unilateral direction in the market now. Pursuing rising prices may lead to being trapped, while bottom fishing makes one fear further decline, and most retail investors are hesitating and observing. In fact, in a fluctuating market, the worst is to frequently open positions back and forth. Understanding key support and resistance levels, managing position sizes and stop losses is far more important than betting on direction. Do not let intraday price spikes disrupt your mindset; patiently wait for the market to choose its true direction, as this will better preserve your account's principal than frequent trading.
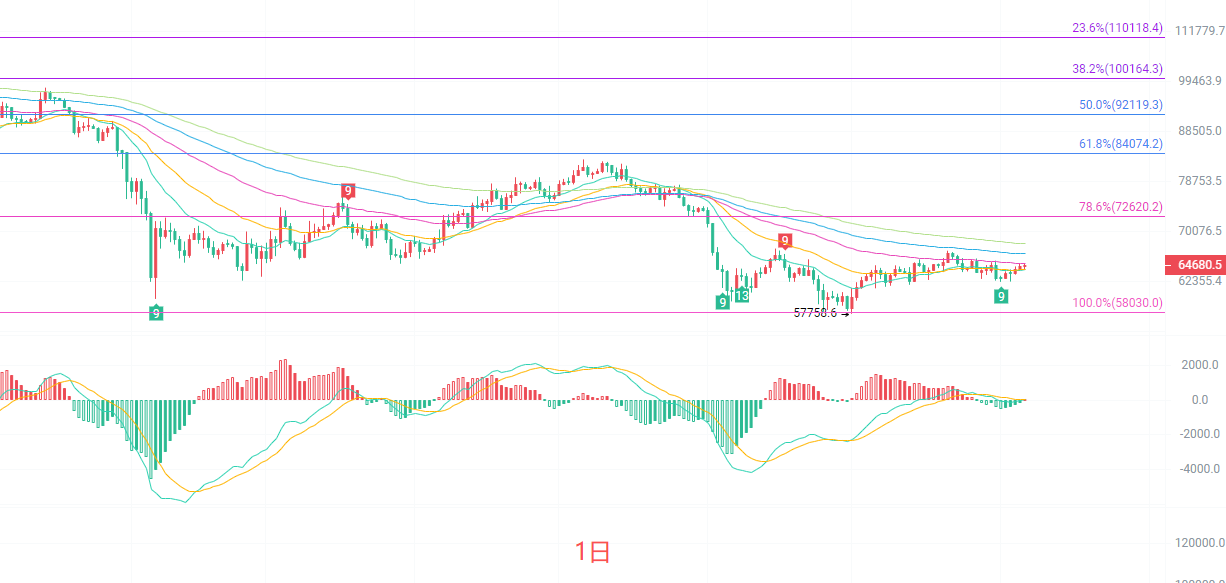
The daily K-line is currently running below multiple EMA moving averages, with short-term moving averages gradually flattening, showing a balanced state of bullish and bearish forces. The Bollinger Bands are overall narrowing, and the market has entered a range consolidation phase. The MACD indicator's DIF and DEA are close to adhesion below the zero axis, and the red column momentum is gradually declining, indicating insufficient upward momentum. The key resistance level above looks towards around 66200, which is also the upper pressure position of the Bollinger Bands; the core support below is at 62500-62600, an important defensive position for this rebound. There is no clear breakout signal on the daily level, and the major trend remains a repair fluctuation after a significant drop, so do not overly bullish or bearish for now.
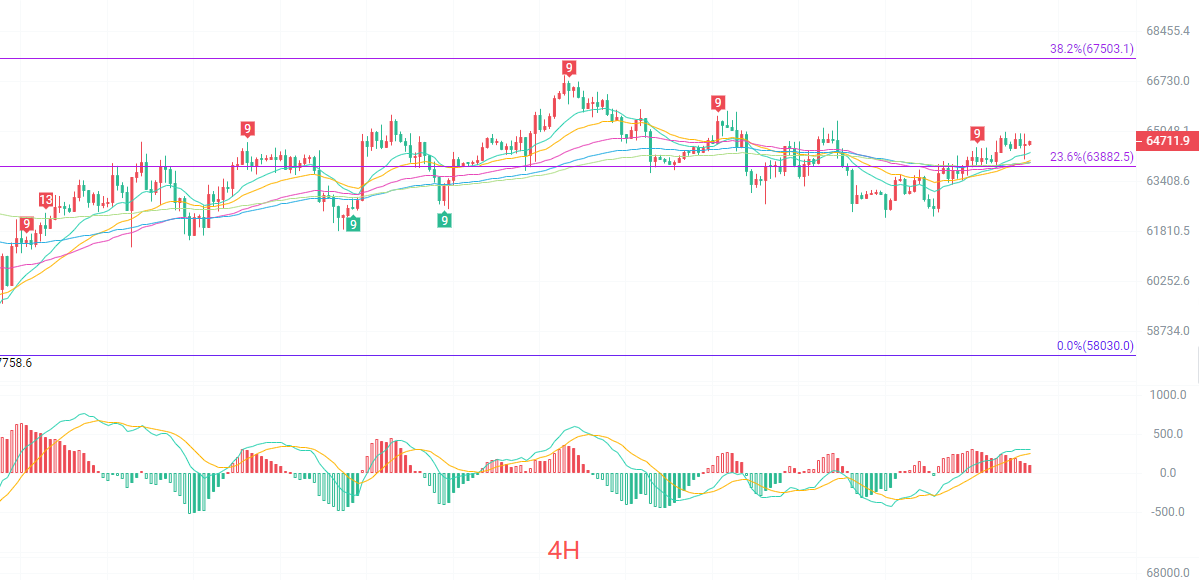
The four-hour K-line is above EMA15 and EMA30, with short-term moving averages forming slight support. The price has stabilized above the Fibonacci 23.6% level at 63882. The Bollinger Bands are moving horizontally, with an upper and lower band range of 63417-64970, and the market is confined to oscillations within this box. The MACD is pulling back and forth with no sustained unilateral momentum. The previous high of 66924 has become a strong short-term resistance, which has failed to hold after multiple tests. Support below is concentrated around the integer level of 64000; if this level is lost, it will further test the lower band around 63400. The four-hour is a typical box fluctuation market, suitable for high selling and low buying, not for chasing highs or cutting losses.
Short-term reference:
If it does not break below 63900 to 63500, go long, stop loss at 63000, target looking at 65500 to 66500.
If it does not break above 67000 to 67500, go short, stop loss at 68000, target looking at 66000 to 65000.
Specific operations should rely primarily on real-time market data; for more information and details, you can consult the author. There may be a delay in article publication; suggestions are for reference only and risks are borne by readers themselves.

Friendly reminder: The above content is solely created by the author of the public account. The advertisements at the end of the article and in the comment section are unrelated to the author. Please be cautious in distinguishing them. Thank you for reading.
免责声明:本文章仅代表作者个人观点,不代表本平台的立场和观点。本文章仅供信息分享,不构成对任何人的任何投资建议。用户与作者之间的任何争议,与本平台无关。如网页中刊载的文章或图片涉及侵权,请提供相关的权利证明和身份证明发送邮件到support@aicoin.com,本平台相关工作人员将会进行核查。