Good morning, teammates. Today's market is under pressure from the news. Bank of America has directly reiterated its forecast for three rate hikes by the Federal Reserve in September, October, and December. Once this statement was made, risk assets took a tumble. Even harsher, the yield on 30-year US Treasuries soared to a new high of 5.2 percent, pushing the risk-free rate higher, and the valuation of risk assets like Bitcoin is naturally being suffocated. Coupled with reports that the new Federal Reserve Chair, Waller, faces a dilemma, the uncertainty in policy has directly pressed down market sentiment. After this wave of negative news, for Bitcoin to still stand above sixty-four thousand can honestly be considered quite tough.
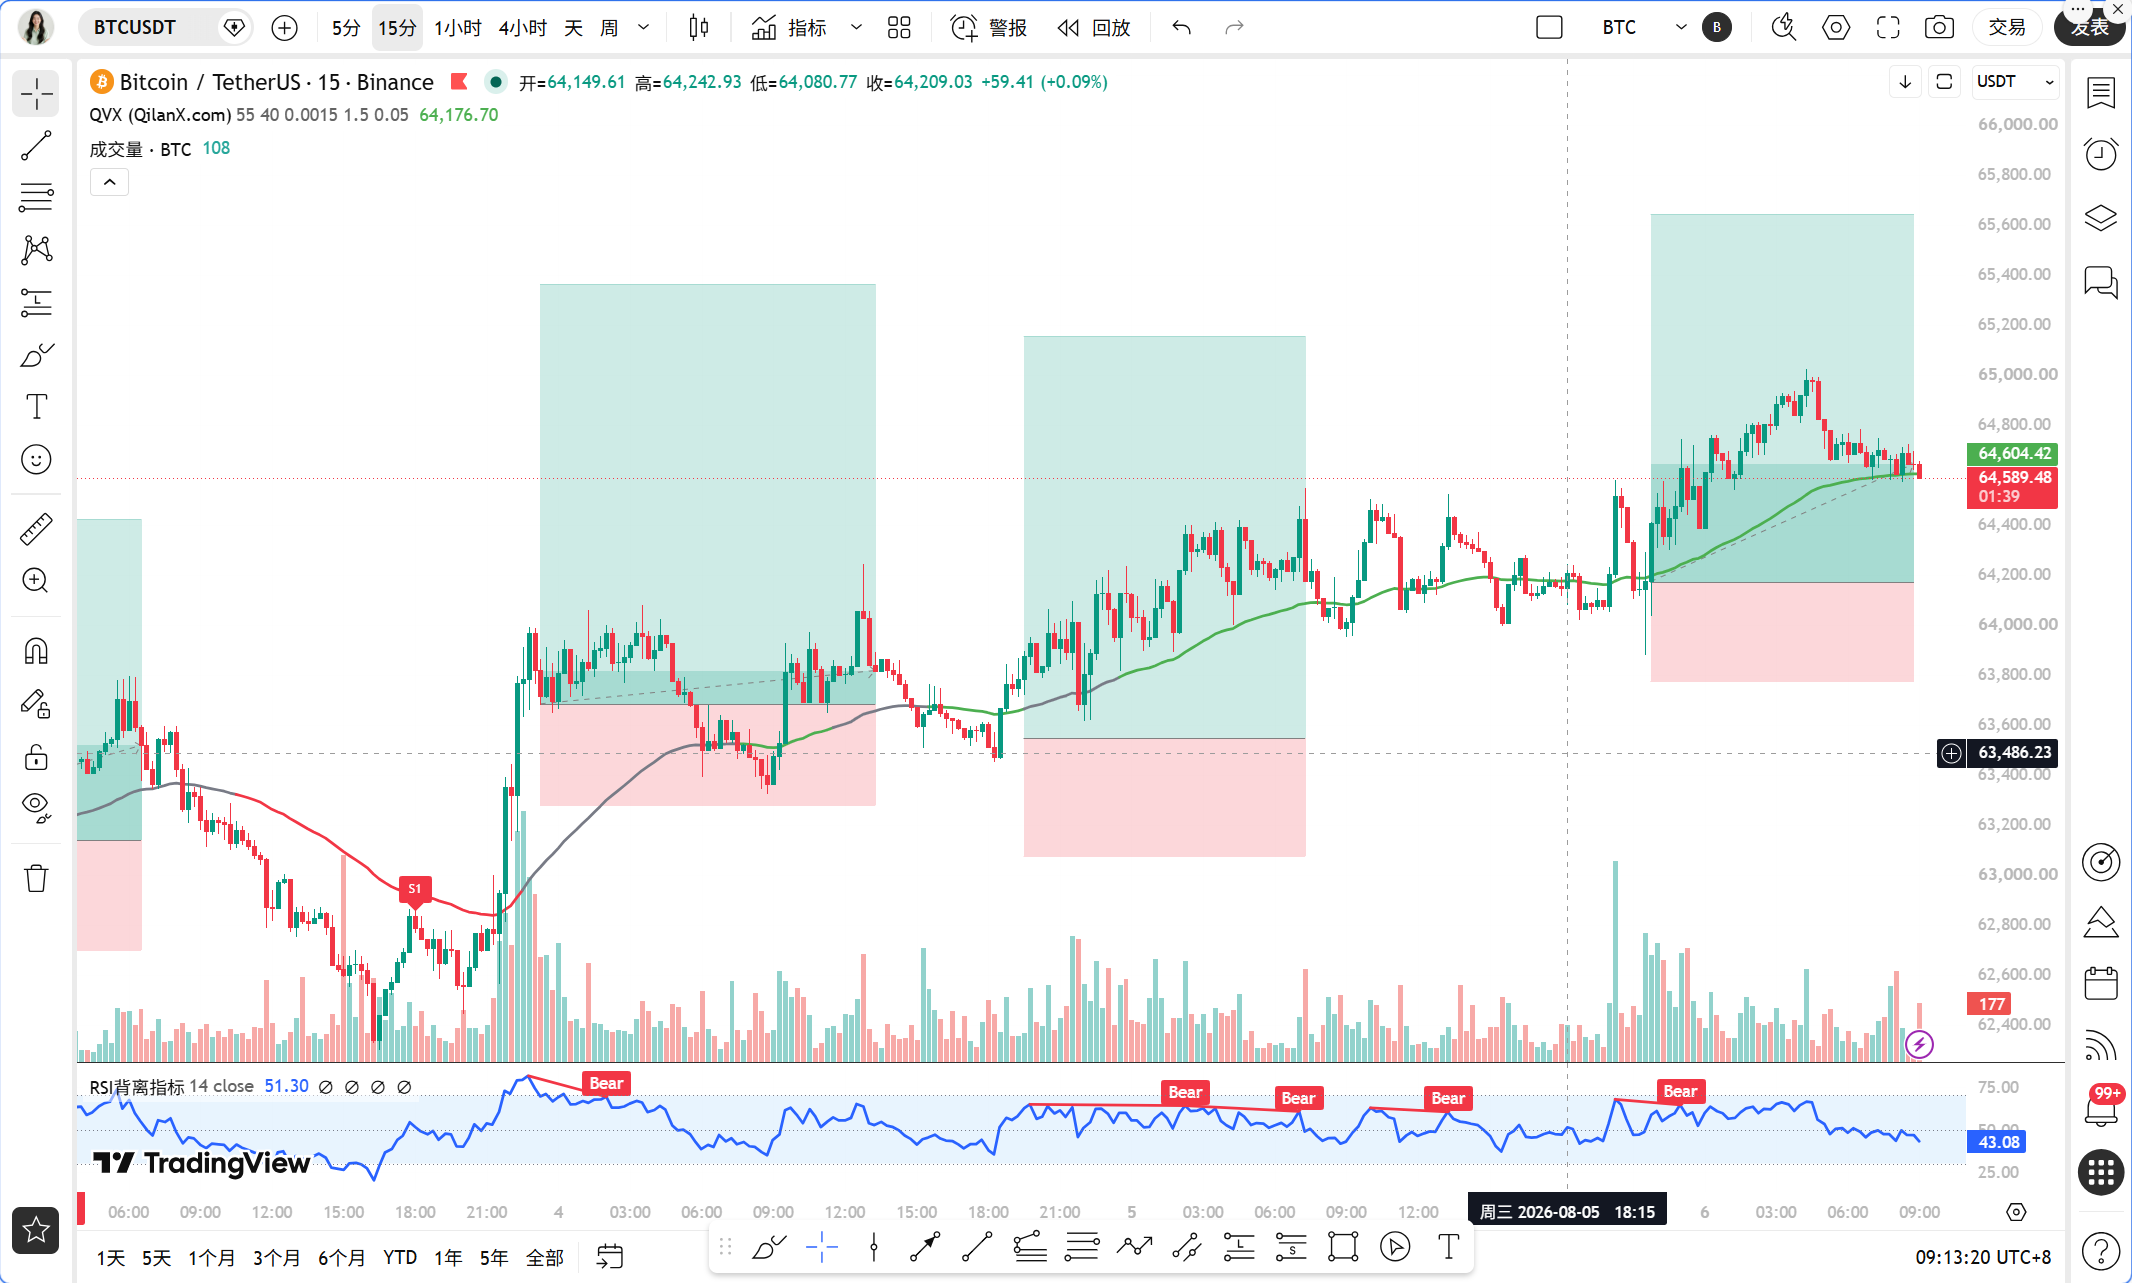
As of now, on August 6th at 9:10 AM, Bitcoin is quoted at sixty-four thousand six hundred thirty dollars, with a 24-hour increase of only 0.92 percent. This position is very delicate, as moving up just one step would hit the resistance zone at sixty-five thousand, and stepping down would test the psychological level at sixty-four thousand. The Fear and Greed Index is only twenty-five, indicating extreme fear, which shows that market sentiment has already cooled to freezing point. However, it is often during these times that it is necessary to look at the market calmly.
First, let's look at the daily chart. The MACD histogram is negative at -5.07, with both DIF and DEA tangled near the zero line, indicating typical momentum exhaustion signals. The RSI is at 47.34, neutral but slightly weak, not reaching oversold or overbought levels. In the moving average system, MA5 and MA10 are merging near sixty-four thousand, while MA30 is at sixty-four thousand two hundred ten. The three moving averages are squeezing together, suggesting the daily level is choosing a direction. The four-hour level looks a bit better, with a MACD histogram of 104.84, DIF above DEA, and RSI at 64.75, indicating that the rebound momentum at the four-hour level is still present, though not strong. The one-hour level is interesting; RSI is at 72.91, which is already in the overbought region, while the MACD histogram is at -10.46, and there are signs of DIF crossing below DEA, indicating a short-term need for a pullback. The fifteen-minute level shows a MACD histogram of -17.2 and an RSI of 40.63, indicating short-term weakness.
Now let's use the Qinglan TPV system to verify the signals. The core rule is to use the one-hour EMA55 as the dividing line for long and short positions. The current EMA55 is at sixty-four thousand one hundred eighty-two point eighty-five, with the current price at sixty-four thousand six hundred thirty, which is above EMA55. The past eight hourly candle closing prices have been above EMA55 eight times, with zero crossings, and the distance to EMA55 is 0.7 percent. According to the system rules, this does not meet the criteria for oscillation and falls into a single-sided bullish trend zone. However, note that the conditions for going long require three simultaneous satisfactions. First, the price needs to stabilize above EMA55, with two consecutive hourly candle closing prices greater than EMA55, and this condition is met. Second, support stabilization requires a long lower shadow or a bottoming pattern or a rebound touching an effective low point, and currently, there are no obvious bottoming formations visible on the chart, so this condition is not met. Third, the declining momentum should be exhausted, such that the MACD histogram shortens for two consecutive periods or the RSI rebounds from below thirty. Currently, the one-hour MACD histogram is negative, and RSI is at a high of 72.91, so this condition is also not met. Therefore, the conclusion given by the TPV system is that although the price is in a bullish area, the conditions for going long are incomplete, and one should not chase long positions.
On-chain data shows the Fear and Greed Index at twenty-five, indicating extreme fear. This position historically often corresponds to stage-bottom areas, but bottoms can take a long time to form and should not be used as a sole entry basis. Bitcoin's market share is at 56.58 percent, indicating that funds are still seeking refuge in Bitcoin, while the liquidity of altcoins is diminishing. In terms of news, the ADP employment data significantly missed expectations, which should be positive because it weakens rate hike expectations, but the market is currently pressed by Bank of America's three rate hike predictions, ignoring the positive news. The news of Circle and Coinbase renewing contracts has limited impact on the overall market, while Arthur Hayes buying ENA is merely small-scale activity. What we really need to be cautious of is Binance suing RedotPay for 470 million dollars, and over sixty projects shutting down this year, which are eroding market confidence.
Looking at the key levels, the first resistance level above is at sixty-five thousand, which is an integer level plus a psychological pressure point. The second resistance level is at sixty-six thousand, which is the previous rebound high area. Below, the first support level is at sixty-four thousand; if this level is breached, the focus shifts to sixty-three thousand five hundred, near one-hour EMA55. The second support level is at sixty-two thousand eight hundred, near the four-hour MA30. If sixty-four thousand is breached, short-term selling pressure will intensify, especially as news has already mentioned Bitcoin breaking below sixty-four thousand.
As for the trading strategy, Qinglan is straightforward with useful insights. The direction is bearish, but don't chase short positions at the current price; wait for a rebound to the resistance level before acting. Entry conditions: If the price rebounds to the range of sixty-five thousand to sixty-five thousand five hundred, and at the one-hour level a top pattern or a long upper shadow appears while the MACD histogram shortens for two consecutive periods, then a small short position can be initiated. Set a stop-loss at sixty-six thousand two hundred, with the target initially at sixty-four thousand, and if breached, then look at sixty-three thousand five hundred. If the price directly breaks below sixty-four thousand, do not chase short; wait for a retracement to confirm before entering, to avoid false breaks. For going long, currently the TPV system does not meet the conditions for going long, so it is not recommended to counter-trade. If the price retraces to the range of sixty-three thousand five hundred to sixty-four thousand and shows significant volume stagnation or a long lower shadow, with RSI rebounding from below thirty, then consider a short-term long position, with a stop-loss at sixty-three thousand and a target of sixty-five thousand.
Risk warning in one sentence: The Federal Reserve's interest rate hike expectations may fluctuate, and policy could change at any time, so strictly control positions and avoid holding onto losing trades.
Follow Qinglan Crypto Classroom to grasp more trading opportunities! Feel free to visit the official website www.qinglan.org
📊 Qinglan TPV trading strategy backtest reference
🕒 Last backtest time 08-06 07:00:01
Total analysis: 3407 Backtests: 3404 Accuracy rate: 81.8% (2785/3404)
免责声明:本文章仅代表作者个人观点,不代表本平台的立场和观点。本文章仅供信息分享,不构成对任何人的任何投资建议。用户与作者之间的任何争议,与本平台无关。如网页中刊载的文章或图片涉及侵权,请提供相关的权利证明和身份证明发送邮件到support@aicoin.com,本平台相关工作人员将会进行核查。