Dear teammates, tonight's market is very interesting. Bitcoin is repeatedly fluctuating around sixty-four thousand, but what really tightens the market's nerves is the surge of U.S. Treasury yields to 5.2%, a historical high. The 30-year Treasury yield has reached a new high, indicating that the risk-free rate continues to rise, which suppresses the valuation of all risk assets. Meanwhile, U.S. Bank reaffirms its forecast of three interest rate hikes by the Federal Reserve in September, October, and December, and Kashkari hints at a gradual rate hike path. With rising rate hike expectations and increasing bond yields, can Bitcoin withstand this sixty-four thousand threshold?
The current time is August 5th, 11:35 PM, with Bitcoin priced at sixty-four thousand five hundred eighty-two dollars, a 24-hour increase of 1.13%. On the surface, bulls are still resisting fiercely, but the signals within the market are much more complicated than the price numbers. The Fear and Greed Index is only twenty-seven, in the fear zone, indicating that market sentiment is not optimistic. Bitcoin's market share is 56.64%, funds are still concentrating on Bitcoin, but overall risk appetite has clearly contracted.
First, let's look at the daily level. The MACD histogram is negative at -60.53, and DIF is running below DEA, indicating that the bearish pattern remains unchanged. The RSI is at 42.11, neutral but slightly weak. The daily MA5 is at 63,720, the MA10 at 63,792, and the MA30 at 64,165; the moving average system is starting to converge, indicating that both bulls and bears have been stalemated at this position for a while. The daily level has not given a clear trend signal, but structurally leans bearish.
The four-hour level is relatively optimistic. The MACD histogram is at 110.71, with DIF above DEA, and bullish momentum is still being released. The RSI is at 78.17, already in the overbought area, so caution is needed when chasing long positions at this level. The four-hour MA5 is 64,222, MA10 is 64,088, and MA30 is 63,450, with the moving averages arranged in a bullish pattern, indicating a short-term upward trend. However, the overbought RSI warns us that the rise at the four-hour level may be approaching a short-term top.
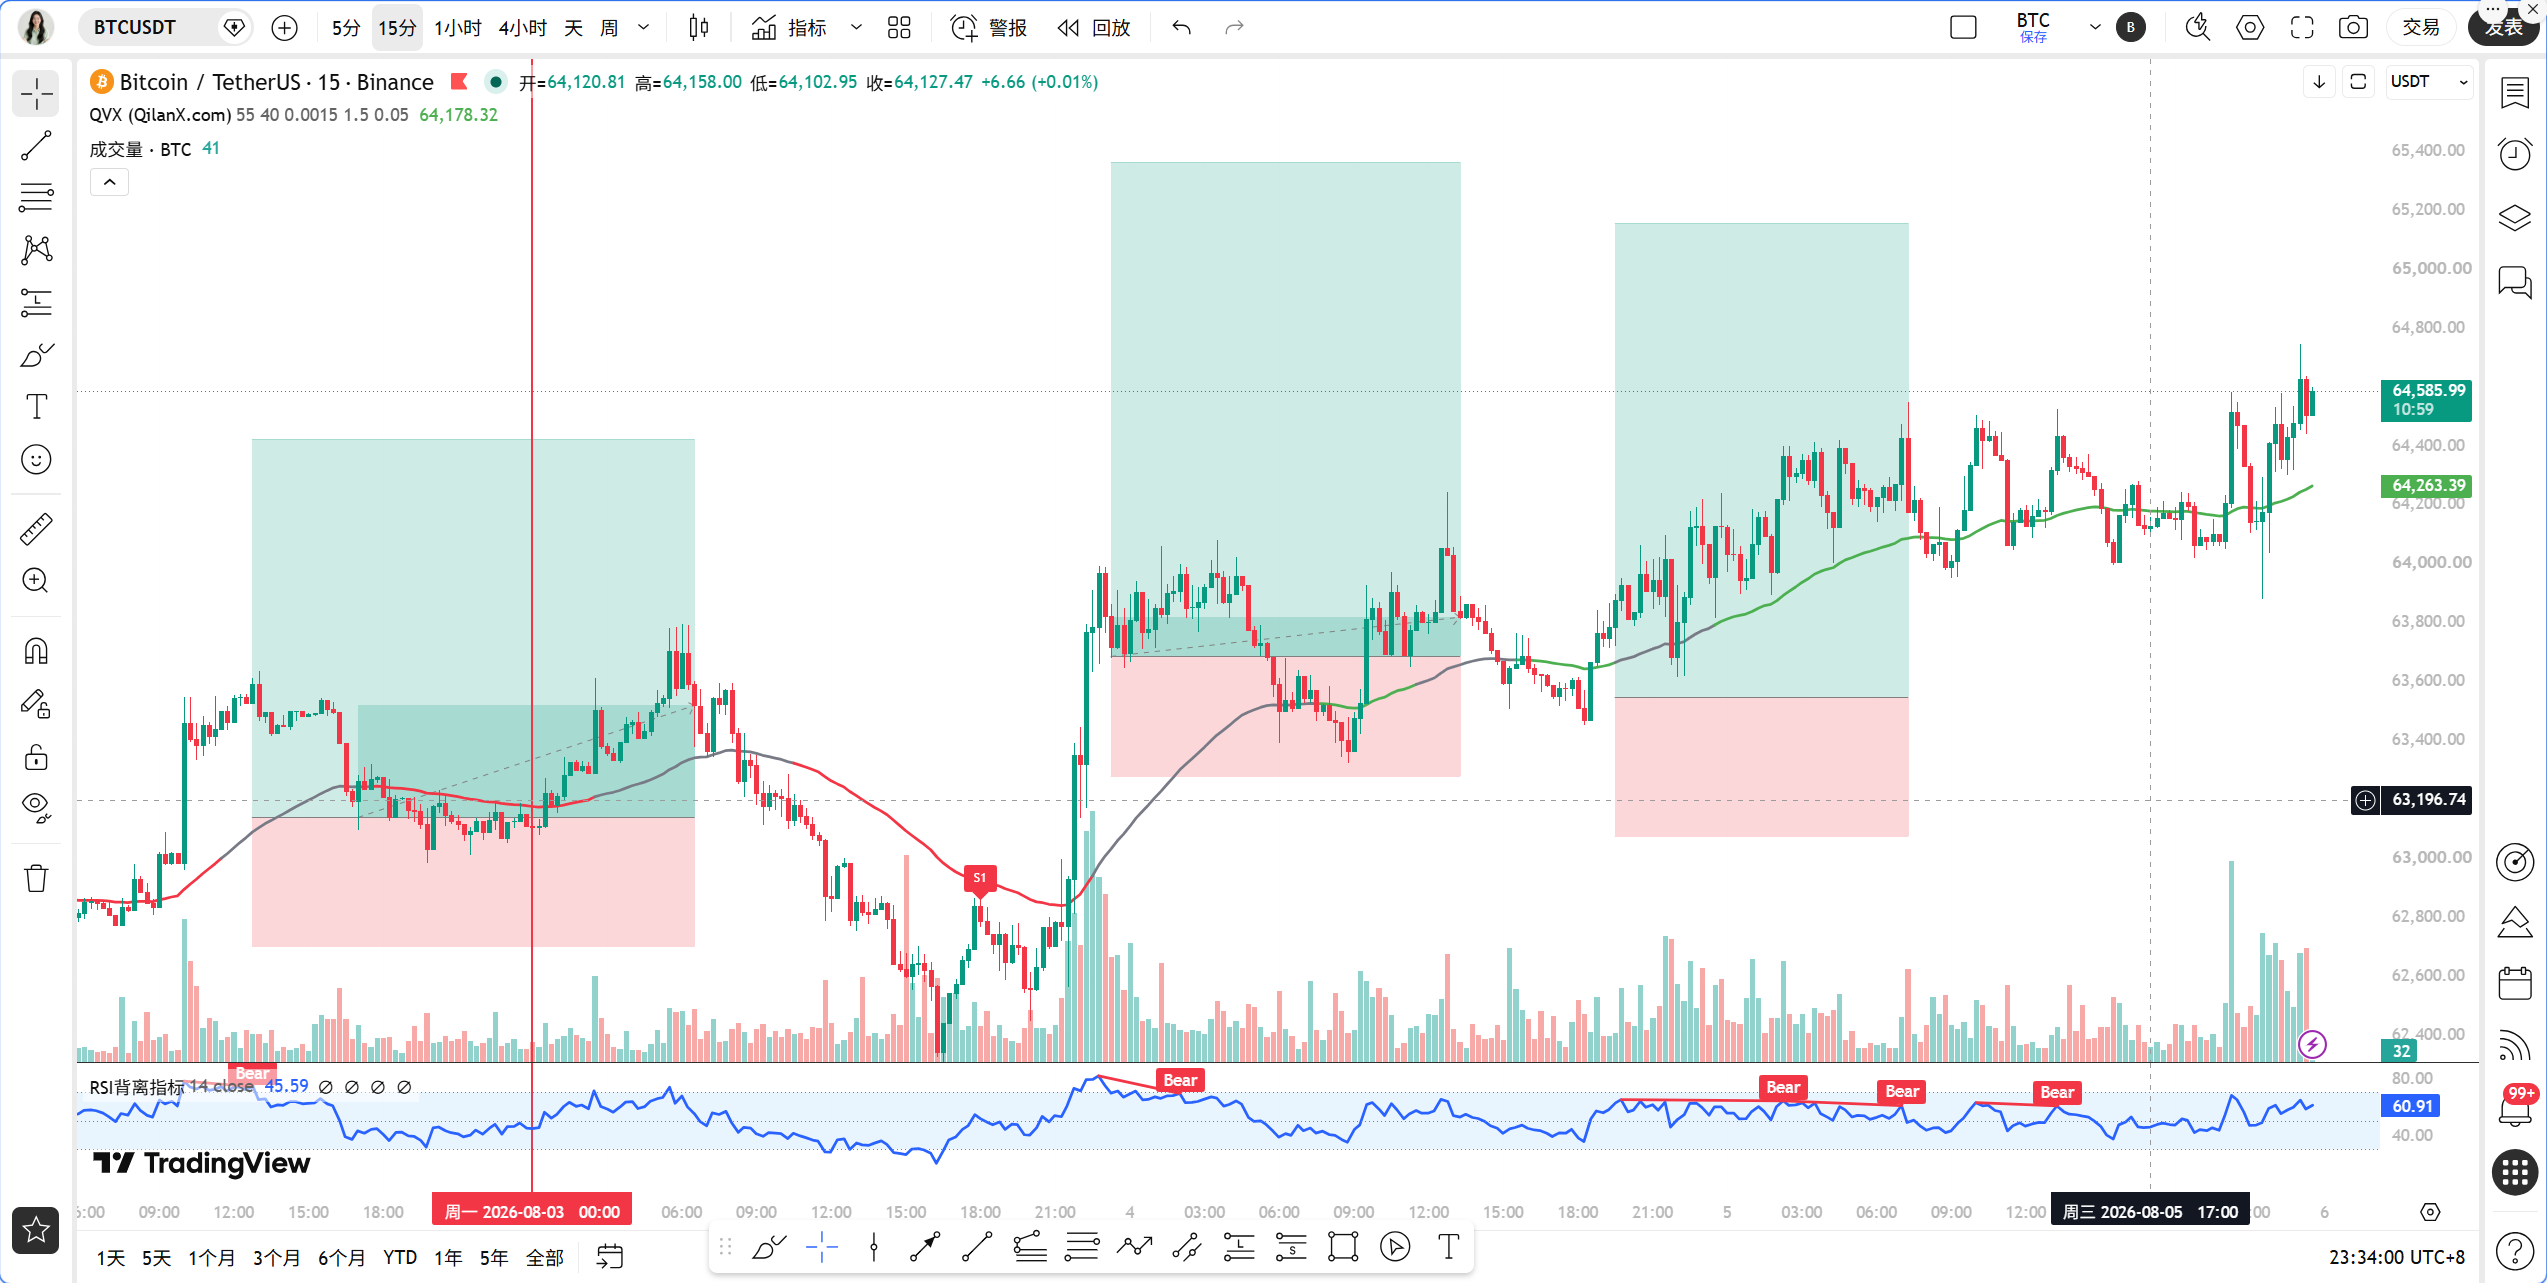
The one-hour level is the key for tonight. EMA55 is at 63,940.61, and the current price is at 64,582, standing just about 1% above EMA55. The MACD histogram is 16.22, both DIF and DEA are above the zero axis, indicating that bullish momentum is still present but clearly weakening. The RSI is at 60.03, neutral but slightly strong. The one-hour MA5 is 64,374, MA10 is 64,262, and MA30 is 64,163, with short-term moving averages bullishly arranged, but the distance is very small, indicating that the upward momentum is not strong enough.
At the fifteen-minute level, MA5 is at 64,524, MA10 is at 64,418, and MA30 is at 64,264, with moving averages arranged in a bullish pattern. The MACD histogram is 32.49, with DIF above DEA, indicating that short-term momentum is still present. The RSI is at 61.83, neutral but slightly strong. The fifteen-minute level is short-term bullish, but the momentum is limited.
Now let's verify the signals using the Qinglan TPV system. First, look at the trend positioning; the current price is above the one-hour EMA55, indicating a bullish trend area. Next, check the oscillation auxiliary data: in the past eight one-hour K-lines, the number of times the closing price was greater than EMA55 is eight, with zero crossings, and the current price's absolute distance from EMA55 is 1%. What does this data indicate? All eight K-lines closed above EMA55, with no crossings, indicating not an oscillation, but a clear bullish trend structure. According to the TPV system rules, the current situation does not meet the oscillation threshold and can be treated as a trending market.
But there is a problem here. Although the trend structure leans bullish, the momentum exhaustion signal in the buy conditions is not perfect. The MACD histogram has been positive continuously, but the values are decreasing, and looking at earlier cycles, the momentum is indeed diminishing. The RSI is at 60.03, with no extreme oversold rebound signal from below thirty. In terms of shape, the current price is stabilizing above sixty-four thousand, but there are no clear long lower shadows or bottom formation structures. Thus, the signal given by the TPV system is: the trend is bullish, but the entry timing needs better shape confirmation.
On-chain data shows a Fear and Greed Index of twenty-seven, with market sentiment leaning towards fear, which is actually a contrarian indicator; extreme fear often corresponds to stage bottoms. However, a value of twenty-seven is not extreme enough; if it drops below twenty, then it would be a true golden pit. Bitcoin's market share of 56.64% indicates that funds are concentrating on Bitcoin, while altcoins will perform weaker than Bitcoin. The 24-hour increase of 1.13% shows that the rebound strength is average, indicating that the bulls are not attacking with full force.
On the news front, tonight is relatively complex. On the bearish side, U.S. Treasury yields soaring to 5.2% is a historical high position, and the pressure on risk assets is systematic. The Fed's three interest rate hike expectations and Kashkari supporting gradual rate hikes are factors suppressing risk appetite. With positive policies running out, analyses showing Bitcoin is still in a bear market are also fermenting. Over sixty projects shutting down, the industry is undergoing a deep cleansing, resulting in insufficient market confidence. On the bullish side, the U.S. July ADP added only 44,000 jobs, far below expectations, and the labor market is clearly cooling, which may weaken rate hike expectations and provide support for Bitcoin's rebound. However, the impact of ADP data seems pale in comparison to the soaring U.S. Treasury yields.
Looking at key attack and defense levels, the first resistance level above is at the psychological level of sixty-five thousand, which is also the recent rebound peak area. If it breaks through sixty-five thousand, the next target looks at the area around sixty-six thousand five hundred, which is the previous dense trading area. The first support level below is at the integer level of sixty-four thousand, which has already been tested multiple times today. If sixty-four thousand is broken, the next support looks at the one-hour EMA55 at sixty-three thousand nine hundred forty, which is the TPV system's bulls and bears dividing line. Further down, sixty-three thousand five hundred to sixty-three thousand is the support area of the daily MA5 and MA10.
In terms of trading ideas, Qinglan provides a clear framework. Direction: bullish, but only enter long positions after confirming pullbacks, do not chase highs. Entry conditions: wait for the price to pull back near the one-hour EMA55, which is in the range of sixty-three thousand nine hundred to sixty-four thousand, and look for a long lower shadow or bottom formation structure while the MACD histogram shortens for two consecutive K-lines, and the RSI maintains above fifty; meeting these three conditions allows for a light position long. Stop loss: place below sixty-three thousand five hundred, that is below the daily MA5, around sixty-three thousand four hundred, with a stop loss margin of about one percent. Target: first target sixty-five thousand, second target sixty-six thousand five hundred. If the price directly breaks through sixty-five thousand with volume, you can wait for a pullback confirmation before adding to the position, moving the stop loss up to sixty-four thousand five hundred.
Risk warning: ongoing soaring U.S. Treasury yields may trigger a repricing of global risk assets. If Bitcoin falls below sixty-three thousand five hundred, long positions must exit unconditionally, do not hold positions.
Follow the Qinglan Crypto Classroom, and let’s seize more trading opportunities together! Welcome to visit the official website www.qinglan.org
📊 Qinglan TPV trading strategy backtesting reference
🕒 Last backtesting time 08-05 07:00:02
Total analysis: 3395 Backtest: 3389 Accuracy: 81.8% (2772/3389)
免责声明:本文章仅代表作者个人观点,不代表本平台的立场和观点。本文章仅供信息分享,不构成对任何人的任何投资建议。用户与作者之间的任何争议,与本平台无关。如网页中刊载的文章或图片涉及侵权,请提供相关的权利证明和身份证明发送邮件到support@aicoin.com,本平台相关工作人员将会进行核查。