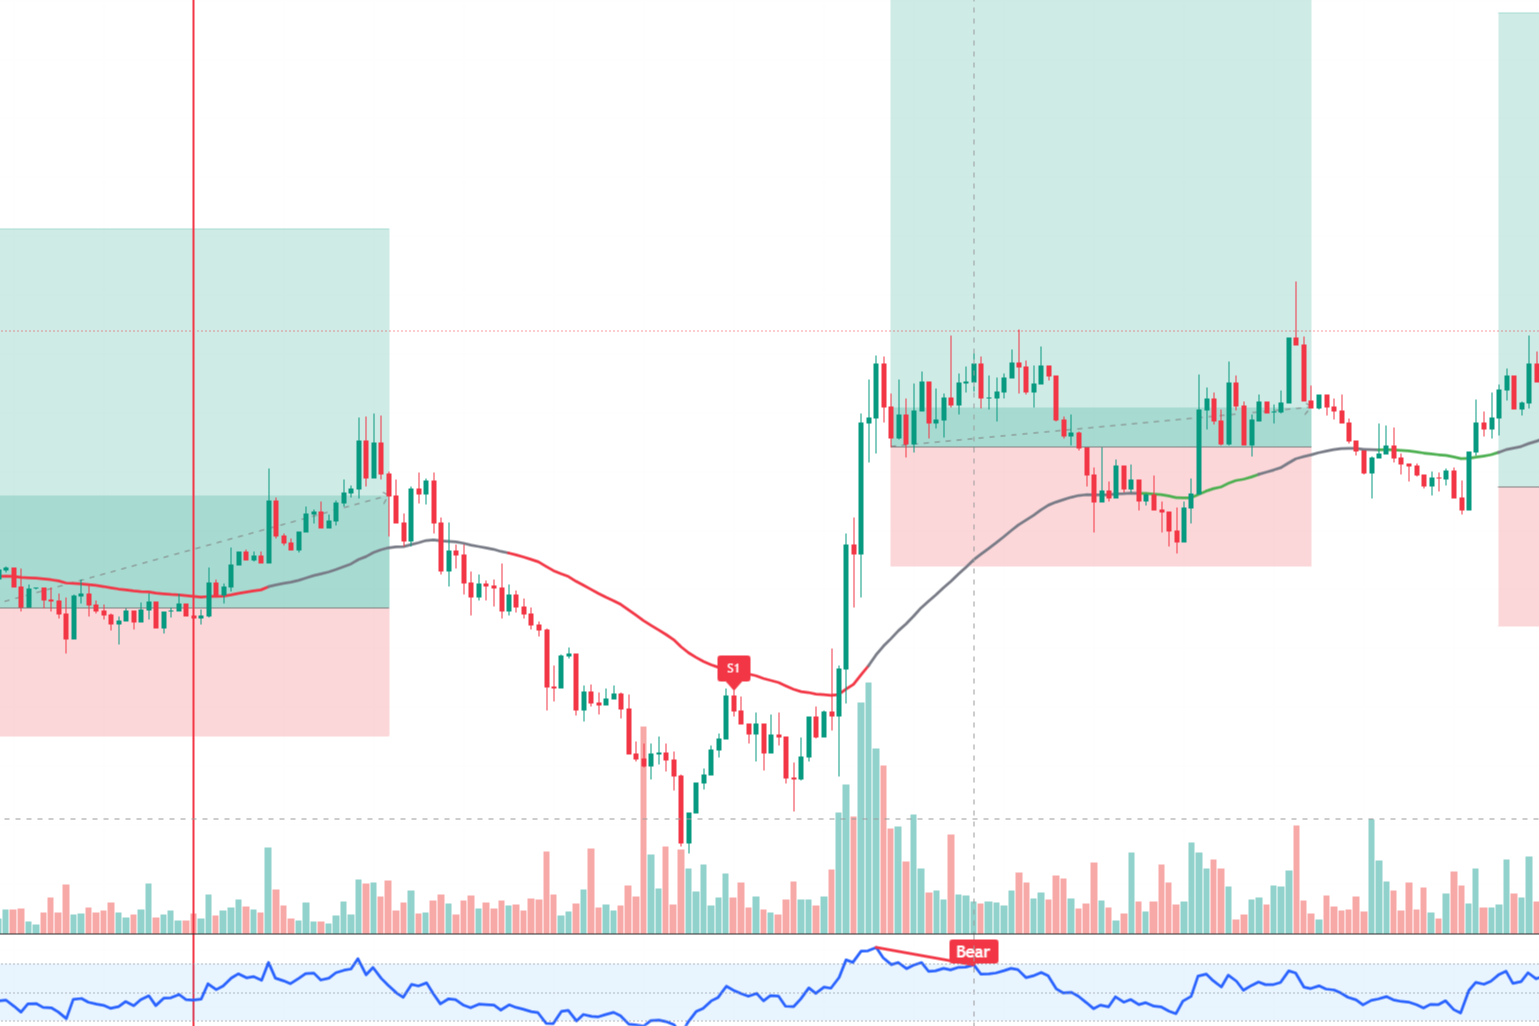
Cryptocurrency Expert: 8.5 Bitcoin (BTC) Long and Short Repeatedly Tear Each Other, Is a Bigger Market Trend Brewing Behind the Consolidation? Latest Market Analysis and Operation Suggestions Explained
The current price of Bitcoin is 64000, but it is often swayed by short-term fluctuations, leading to emotional turmoil. A slight rise fuels fantasies of a bull market, while a small dip causes panic over an impending crash, resulting in a back-and-forth of chasing highs and cutting losses. Currently, Bitcoin is stuck around 63900 with repeated fluctuations; this indecisive market is the most exhausting. In a fluctuating market, what matters is not the imagination of getting rich quickly, but the control over key support and resistance levels. If you match the rhythm correctly, there’s no need to gamble on a big trend; even small waves can yield steady profits,
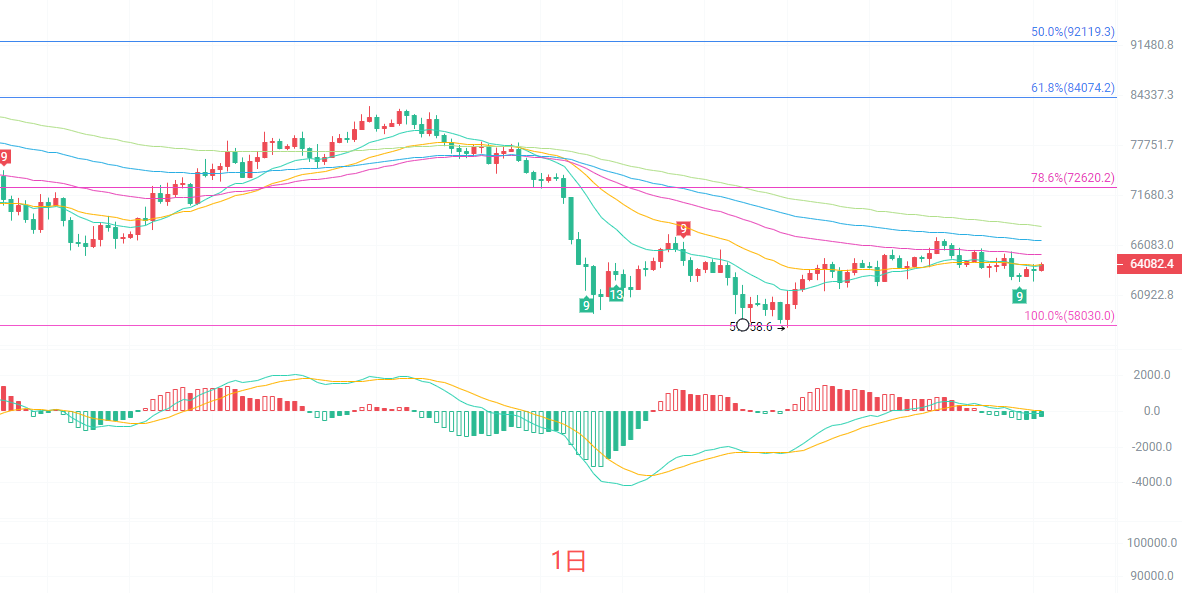
The daily K-line is overall in the stage of repairing the bottom of a large range, with prices running below the mid-line, and the moving average system showing a tangled and flat state, with no clear single-side trend in the short term. The previous low of 58030 constitutes important bottom support, while the first resistance above is around 67500. The MACD indicator shows DIF and DEA are closely glued at low levels, and there’s no significant increase in long and short momentum, with alternating red and green bars, indicating a balance in the daily level battle between bulls and bears. The Bollinger Bands are continuously narrowing, indicating that a major trend reversal window is approaching. Trading volume is maintaining a moderate level, with no new funds entering the market. For now, the daily is treated as range consolidation; do not blindly predict a substantial rise or fall before a key breakthrough occurs.
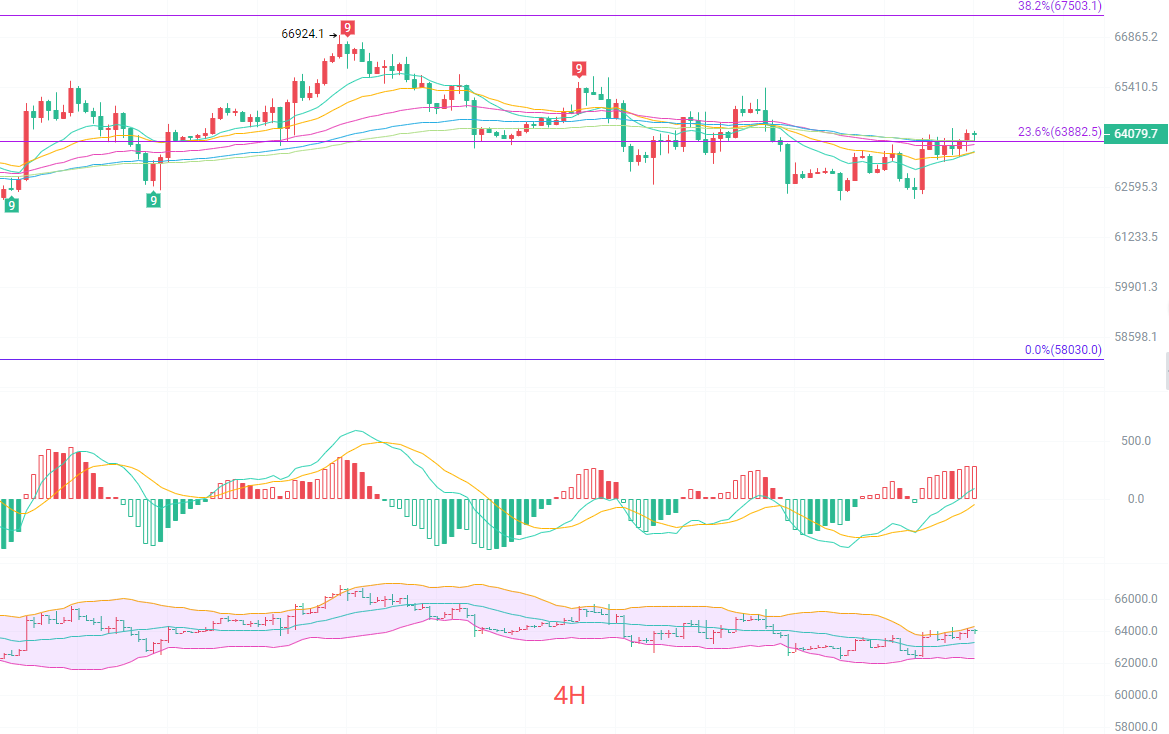
The four-hour K-line is operating at the Fibonacci 23.6% level near 63882, with short-term prices closely navigating above and below several EMA moving averages. The moving average group is highly tangled, representing a typical fluctuation structure. The Bollinger Bands are further compressing, with the upper band at 64292 and the lower band at 62358, keeping prices tightly confined within the channel. The MACD indicator's fast and slow lines keep pulling back and forth around the zero axis, with no sustained expansion of long and short bars, indicating limited bullish rebound strength and a lack of continuity in bearish pressure. Strong support below is at 62350, while short-term pressure above is at 64300. The market shows no effective breakout; in the short term, it's merely bouncing back and forth within the range, and chasing orders can easily lead to losses. It’s advisable to wait for the price to approach the edge of the range before making a move.
Short-term Reference:
If it does not break below 62500 to 62000, aim north, with a stop loss at 61500 and target looking at 63500 to 64500.
If it does not break above 64600 to 64200, aim south, with a stop loss at 65000 and target looking at 63500 to 63000.
Specific operations should be based on real-time market data. For more details, you can contact the author. The article has a delay in publishing; it is advised for reference only, and the risk is borne by the reader.

Warm Reminder: The above content is solely created by the author's public account. The advertisements at the end of the article and in the comments are unrelated to the author, please be cautious in discerning them. Thank you for reading.
免责声明:本文章仅代表作者个人观点,不代表本平台的立场和观点。本文章仅供信息分享,不构成对任何人的任何投资建议。用户与作者之间的任何争议,与本平台无关。如网页中刊载的文章或图片涉及侵权,请提供相关的权利证明和身份证明发送邮件到support@aicoin.com,本平台相关工作人员将会进行核查。