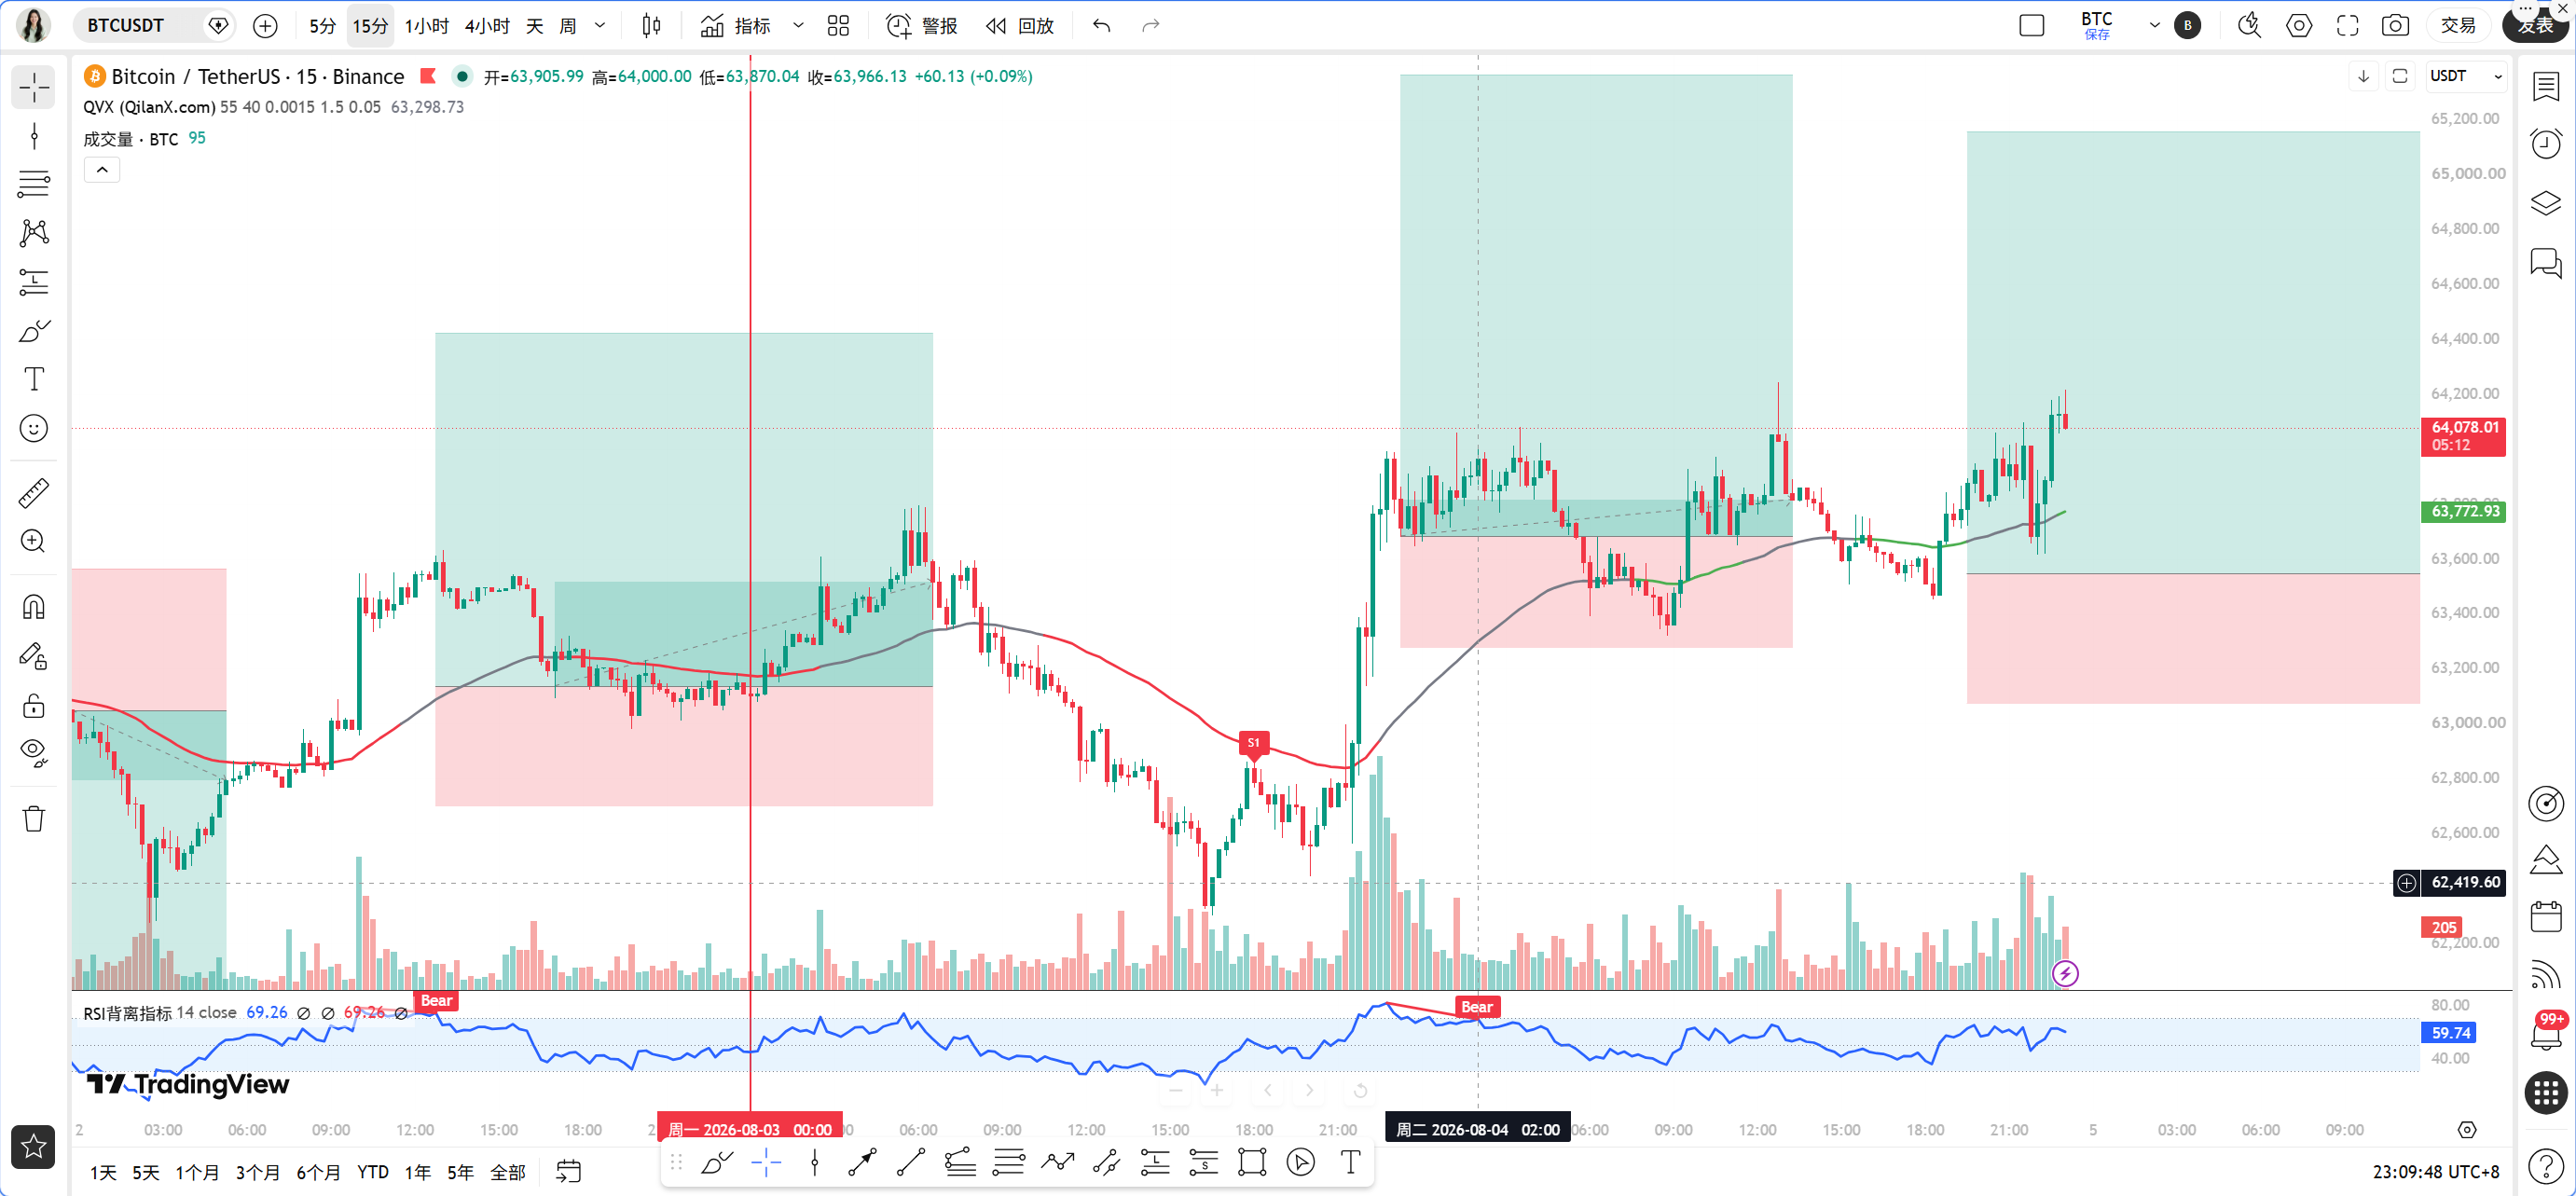
The market tonight is quite interesting, as the news brings a stark contrast. On one hand, U.S. Treasury Secretary Yellen stated that core inflation is slowing, and the Federal Reserve needs to plan ahead, which ignited market expectations for interest rate cuts; on the other hand, BlackRock threw cold water on this, saying that U.S. Treasury yields will continue to rise if the Federal Reserve remains inactive, which added a weight on risk assets. More concerning is that the market trader TwoEyes has publicly increased short positions on BTC and MicroStrategy-related assets; although this clear short position may not be immediately realized, it at least indicates that there is capital laying out short positions above sixty-four thousand. Both bullish and bearish logics have support, causing the market to get stuck in a stalemate.
As of the current time, August 4th, 11:11 PM, BTC is priced at 64015 USDT, with a 24-hour increase of only 0.25%, basically treading water. The Fear and Greed Index has reached 25, indicating extreme fear; such sentiment data often means massive market divergence but can also be a prelude to a trend change. BTC's market share is 56.56%, indicating that capital is still circulating among mainstream coins, and there seems to be no visible continuation in altcoin trends at the moment.
First, let's look at the daily level. MA5 is at 63363, MA10 is at 63865, and MA30 is at 64144, with the price neatly stuck between the three moving averages, representing a typical state of moving average entanglement. MACD's DIF is at -93.91 within the negative zone, DEA is at 46.37, and the histogram at -140.28 is still expanding, indicating the daily level's downward momentum has not yet fully exhausted. RSI is at 36.76, still some distance from the oversold zone, but it is not strong. My impression from the daily level is that the larger trend still leans bearish, but there is a short-term need for a correction; whether this is a continuation of the downward trend or a bottom reversal, there are currently no clear signals.
Next, looking at the 4-hour level. MA5 is at 63789, MA10 is at 63456, and MA30 is at 63415, with short to medium-term moving averages starting to converge, and the price above the moving averages. MACD's DIF is at 48.66, DEA is at -88.00, and the histogram is at 136.66, which is quite substantial, indicating that the rebound momentum at the 4-hour level is in fact not weak. RSI is at 55.79, neutral to slightly strong. The 4-hour chart shows a bottom lifting structure, but caution is needed regarding whether this momentum can be sustained at the daily level to change the trend.
The 1-hour level is the focus of tonight. MA5 is at 63932, MA10 is at 63797, and MA30 is at 63653, with a bullish arrangement of moving averages. MACD's DIF is at 140.33, DEA is at 130.73, and the histogram is at 9.60; although the red bars are still present, they are clearly shortening, indicating that the upward momentum at the 1-hour level is weakening. RSI is at 54.43, neutral. The most important factor is EMA55 at 63504.78, and the current price of 64015 is approximately 0.8% above EMA55; this level is not large, but it at least indicates that the short-term trend is still on the bullish side.
At the 15-minute level, MA5 is at 63991, MA10 is at 63939, and MA30 is at 63774, with the moving averages also arranged in a bullish manner. MACD's DIF is at 81.74, DEA is at 60.82, and the histogram is at 20.92, with red bars still expanding, indicating that there is still inertia for a short-term climb. RSI is at 54.67, not overbought.
Now, let’s use the Qinglan TPV system to verify the signals. First, looking at trend positioning, the current price of 64015 is above the 1-hour EMA55 of 63504.78, and among the past 8 1-hour K lines, the closing price has been above EMA55 8 times, with 0 crossings; this indicates the price is firmly above EMA55, belonging to a clear bullish trend area, not conforming to consolidation conditions. Next, looking at the long conditions, the first condition is that the price must hold above EMA55, and the closing prices of two consecutive 1-hour K lines must be above EMA55; this condition is satisfied. The second condition for support to stabilize requires a long lower wick, a bottom formation, or a rebound from a valid low point; from the current market, there have indeed been multiple supports around 63500, essentially satisfying this condition. The third condition of weakening downward momentum requires that the MACD histogram shorten for two consecutive cycles or that RSI rebounds from a low position; currently, the MACD red bars are shortening, and RSI has rebounded to above 54 from a low position, this condition is also met. Therefore, from the perspective of the TPV system, the 1-hour level meets the conditions for going long.
However, I want to remind you that the TPV system provides a probability advantage, not a certainty. The bearish trend at the daily level is still present, and while the rebound momentum at the 4-hour level is strong, whether it can be transmitted to the daily level to change the pattern still needs to be observed. Therefore, my stance is that the direction leans bullish, but positions should be controlled, and entering the market requires patience.
Regarding on-chain data, the Fear and Greed Index at 25 indicates extreme fear, a figure that historically corresponds to phase bottom regions, but may also continue to blunt. Wintermute said that the marginal selling pressure in crypto is close to exhaustion, and rebounds still need caution; this statement is quite fair, as the selling pressure has indeed eased, but the buying pressure has not entered on a large scale, so the continuity of the rebound is questionable. Strategy liquidated 1638 BTC for cashing out $105 million; although Michael Saylor clarified that his personal holdings had not changed, the actions of institutions reducing holdings can psychologically pressure the market. The Coldcard vulnerability incident is still fermenting, and while the scale of selling triggered by safety concerns is not large, it can be amplified during emotionally fragile phases. Overall, the capital front is neutral, showing no significant signs of incremental capital entering, and characteristics of stock game are quite obvious.
As for key levels of attack and defense, the first resistance level above looks at the 64500 to 64800 area, which is the lower edge of a previous high volume trading zone and serves as a watershed for whether the 4-hour level rebound can continue. If there is a volume breakout above 64800, the upper space opens up, looking towards 65500 or even 66000. The first support level below looks at 63500, which is also where the 1-hour EMA55 is located; if this level is lost, the bullish trend will declare an end, with support levels below looking at the integer level of 63000 and the daily level support of 62500. The core operation tonight is to focus on the range from 63500 to 64800; whichever side breaks through, follow that side, but before the breakout, high selling and low buying within the range should maintain controlled positions.
In terms of trading ideas, I provide two plans. Plan One: Buy on dips. If the price pulls back to the 63500 to 63700 range and there are signs of a halt at the 1-hour level, such as a long lower wick, bottom formation, or MACD histogram shortening, a small position can be taken to go long, with a stop-loss set below 63200, targeting 64500, and adding to positions if it breaks above 64800 to look towards 65500. Plan Two: Follow the breakout. If the price breaks above 64800 with considerable volume and the 1-hour K line closes firmly above, you can chase the long position, with a stop-loss placed below 64400, targeting levels from 65500 to 66000. If the price dips below 63500 and the 1-hour K line closes below EMA55, then the bullish logic is invalid, remaining flat and observing, do not counter-trend catch the falling knife.
Risk reminder in one sentence: The bearish trend at the daily level has not changed, any rebound may be a trap for bulls; strict stop-loss is the only rule for survival.
Follow Qinglan Crypto Classroom to grasp more trading opportunities! Welcome to visit the official website www.qinglan.org
📊 Qinglan TPV Trading Strategy Backtest Reference
🕒 Last Backtest Time 08-04 07:00:01
Total Analysis: 3377 Backtests: 3373 Accuracy: 81.9% (2762/3373)
免责声明:本文章仅代表作者个人观点,不代表本平台的立场和观点。本文章仅供信息分享,不构成对任何人的任何投资建议。用户与作者之间的任何争议,与本平台无关。如网页中刊载的文章或图片涉及侵权,请提供相关的权利证明和身份证明发送邮件到support@aicoin.com,本平台相关工作人员将会进行核查。