Crypto Circle Academician: The 8.4 Bitcoin (BTC) long and short momentum tends to be balanced, with sideways trading hiding directional divergence? Latest market analysis and operation suggestions explained
The current price of Bitcoin is 63800, and the choppy trading is wearing down traders' patience; recently, the market has been probing back and forth, likely making many people feel deeply. Always thinking about predicting breakthroughs in advance and eager to take large positions for directional betting often leads to being washed out by the market first. In trading, patience is far more important than prediction; when opportunities do not appear, holding assets and waiting is also a form of operation. Stop-loss is never a constraint; it is about safeguarding the bottom line of the principal. Do not have the lucky mentality of holding onto losing positions hoping for a reversal. There is no need to force capturing every segment of the market; only focus on opportunities that are understandable with clear risk-reward ratios. It is wiser to wait for Bitcoin to choose a direction out of the range and go with the flow than to gamble subjectively on long or short positions.
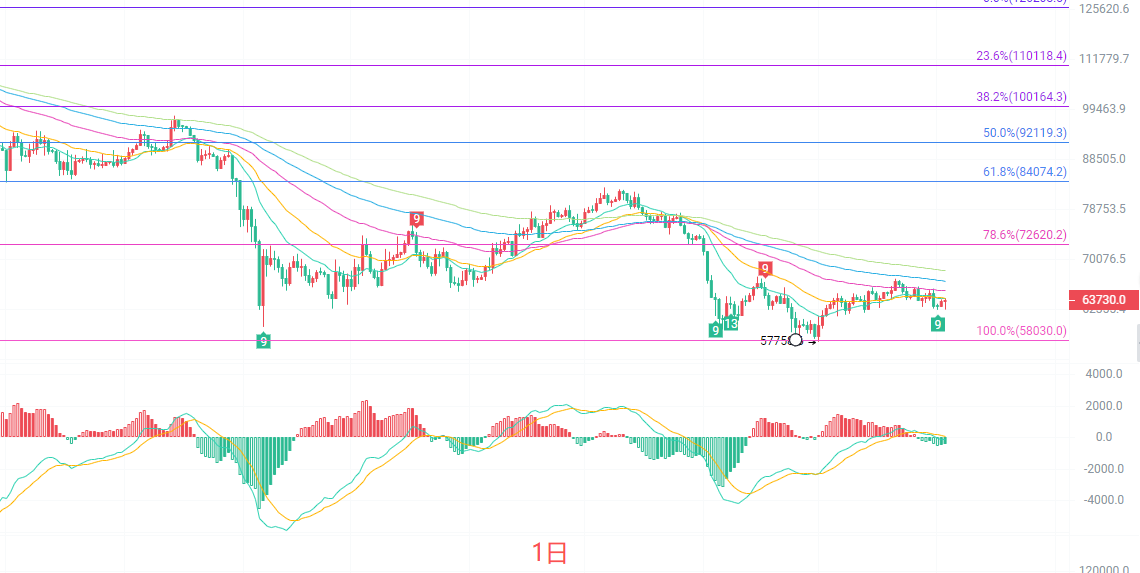
The daily K-line continues to run below multiple EMA moving averages, with medium to long-term moving averages forming pressure above. The Bollinger Bands are gradually narrowing, indicating that the market's volatility will continue to contract, with the window for a trend change approaching. The MACD indicator's red bars are continuously shrinking, with upward momentum constantly weakening, and there is not enough strength for an upward attack at the moment. The previous low of 57758 serves as important bottom support, while the primary resistance above is at 66271, the upper band of the Bollinger Bands. The daily level is generally in a bottom recovery and oscillation pattern after a decline. Until effectively breaking above the moving average pressure, the overall trend still leans toward being under pressure, and it is currently challenging to initiate a sustained upward trend.
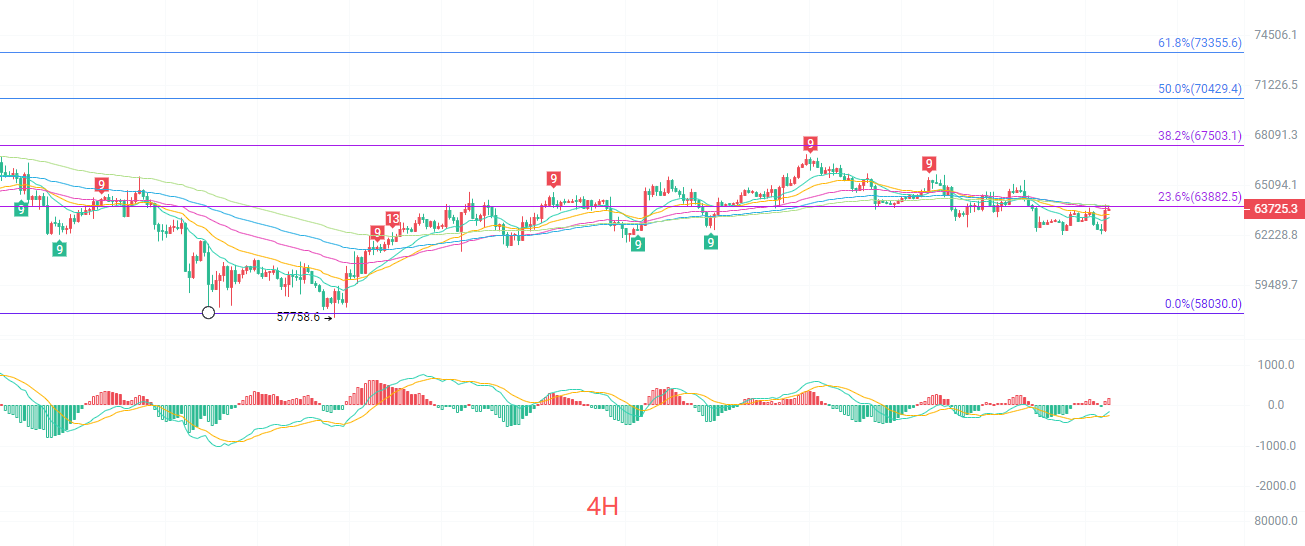
The four-hour K-line oscillates in a narrow range around the EMA moving averages, currently under pressure near the 23.6% Fibonacci level of 63882; the current price is just near this resistance level. The Bollinger Bands continue to narrow, compressing the range further, with the upper and lower bands defining the short-term oscillation range of 62320—63803. The MACD dual lines are flattening, with long and short momentum tending toward balance, without a clear directional breakout. In the short term, repeated attempts to test lower support have not resulted in effective breakouts, but the rebound strength remains weak. The short cycle is a typical range oscillation trend; without breaking out of the range, do not blindly predict a one-sided move; higher selling and lower buying are more suitable for the current market structure.
Short-term reference:
Do not break below 62500 to 62000 for an upward move, stop-loss at 61500, target at 63500 to 64500.
Do not break above 63800 to 64200 for a downward move, stop-loss at 64600, target at 63000 to 62500.
Specific operations are based on real-time market data; for more information, you can consult the author. Article publication may be delayed; suggestions are for reference only, and risks are borne by the reader.

Friendly reminder: The above content is solely created by the author of the official account; advertisements at the end of the article and in the comments section have no relation to the author, please discern carefully, thank you for reading.
免责声明:本文章仅代表作者个人观点,不代表本平台的立场和观点。本文章仅供信息分享,不构成对任何人的任何投资建议。用户与作者之间的任何争议,与本平台无关。如网页中刊载的文章或图片涉及侵权,请提供相关的权利证明和身份证明发送邮件到support@aicoin.com,本平台相关工作人员将会进行核查。