Cryptocurrency Scholar: The 8.4 Ethereum (ETH) fluctuation structure hides a signal of a change in trend, is a turning point brewing? Latest market analysis reference
Ethereum's current price is 1870. At this stage, Ethereum's lackluster movement is a true test of composure. The most taboo in a fluctuating range is making subjective judgments about direction, always feeling that a breakthrough is imminent, and preemptively staking heavily makes it easy to get swept away in back-and-forth losses. Do not fantasize about accurately catching the highest or lowest points; we only earn from the market within our own understanding. Every trade should have a pre-planned stop loss, avoiding holding positions to average costs. Opportunities are always flowing continuously; there is no need to rush at a moment's notice. Learning to stay in cash and wait is also an important fundamental lesson in trading.
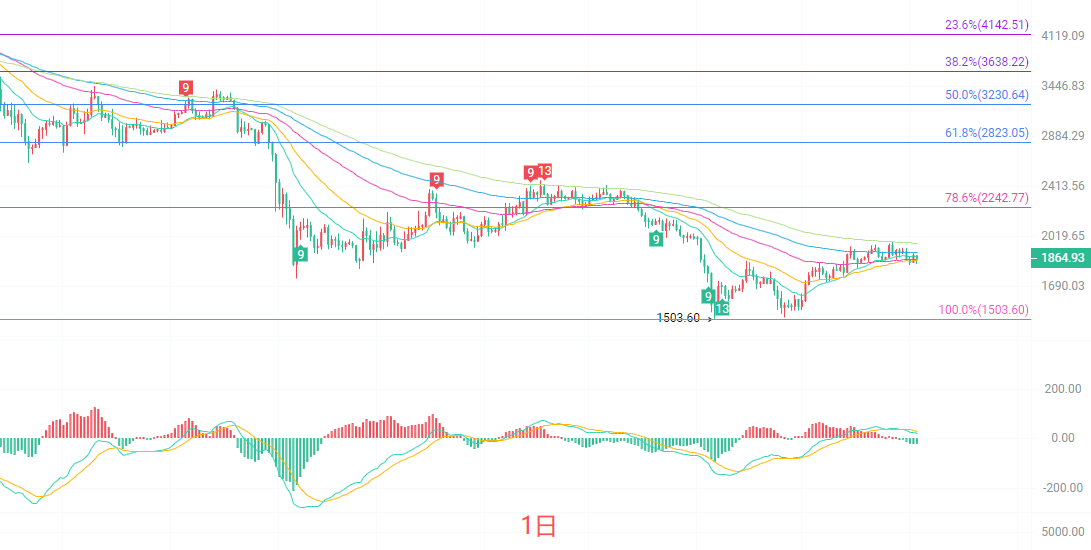
The daily K-line began to rebound from a low of 1503 and is currently operating near the short-term moving averages. Multiple EMA moving averages are gradually flattening, and the upward momentum has clearly slowed. The Bollinger Bands continue to narrow, indicating that volatility will further converge. The MACD indicator remains weakly operating above the zero axis, with red bars continuously shrinking, and bullish strength is gradually diminishing. The primary resistance above is around 1970, while key support below is at the 1826 level. The daily level has not yet broken the bottom rebound structure, but ongoing pressure with an inability to break previous highs presents the possibility of a pullback confirming support, likely maintaining a range-bound fluctuation pattern in the short term.
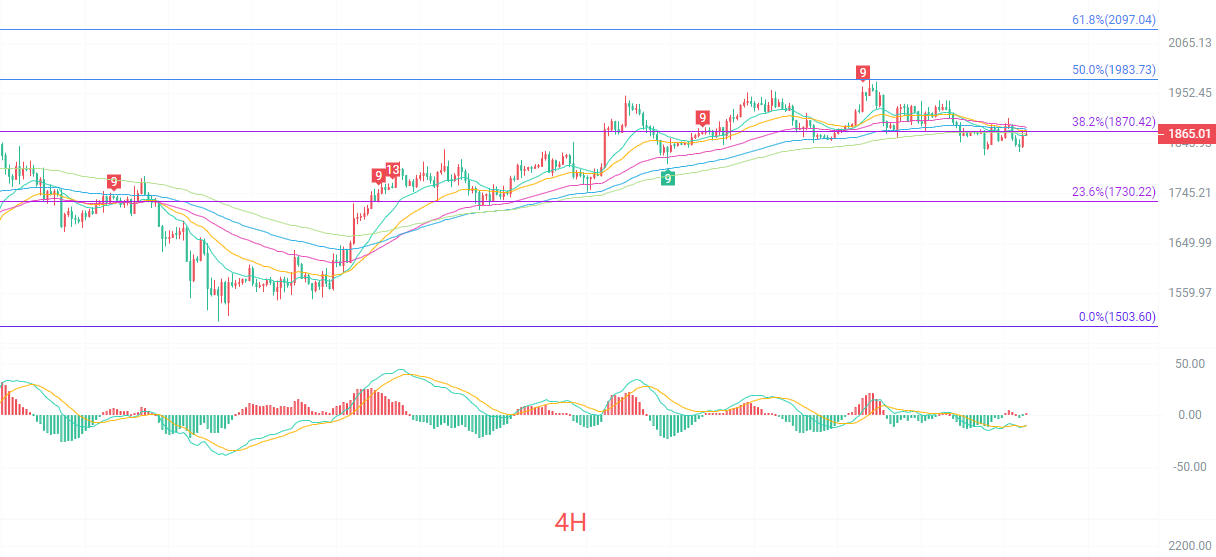
The four-hour K-line is under pressure near the Fibonacci 38.2% level around 1870. The short-term EMA moving averages are intertwined and balanced between bulls and bears. The Bollinger Bands are running horizontally, with prices closely following below the middle track of the Bollinger Bands. The MACD double lines are close to the zero axis, and the momentum bar is weak, showing no signs of sustained one-sided signals. The previous high of 1982 constitutes strong resistance, while support below is at 1730. Recently, there have been multiple upward tests that have faced resistance and fallen back, indicating insufficient bullish strength. If it cannot stabilize above the 1870 level, it will continue to test the lower Bollinger Band support at 1835 in the short term. Only a volume breakout above 1900 can open up a new upward space.
Short-term reference:
If the 1800 to 1850 level below does not break, go bullish with a stop loss at 1760, targeting 1880 to 1920.
If the 1980 to 2020 level above does not break, go bearish with a stop loss at 2050, targeting 1930 to 1890.
Specific operations should be based on real-time market data; for more information, you can consult the author. There may be delays in the publication of the article, so it is advised for reference only and risks are borne by the reader.

Warm reminder: The above content is solely created by the author for the public account, and the advertisements at the end of the article and in the comment area are unrelated to the author. Please be cautious in distinguishing, and thank you for reading.
免责声明:本文章仅代表作者个人观点,不代表本平台的立场和观点。本文章仅供信息分享,不构成对任何人的任何投资建议。用户与作者之间的任何争议,与本平台无关。如网页中刊载的文章或图片涉及侵权,请提供相关的权利证明和身份证明发送邮件到support@aicoin.com,本平台相关工作人员将会进行核查。