Issue 21 of "Jiang Feng Trading Strategy Diary"
This article will carefully analyze the current market state from the perspectives of the halving cycle, macro fundamentals, on-chain data, and market trends, with specific operational suggestions at the end. Be patient and read to the end for surprises! When is the right time to buy the dip? How to buy the dip? Keep reading.
Yesterday’s Strategy Review:
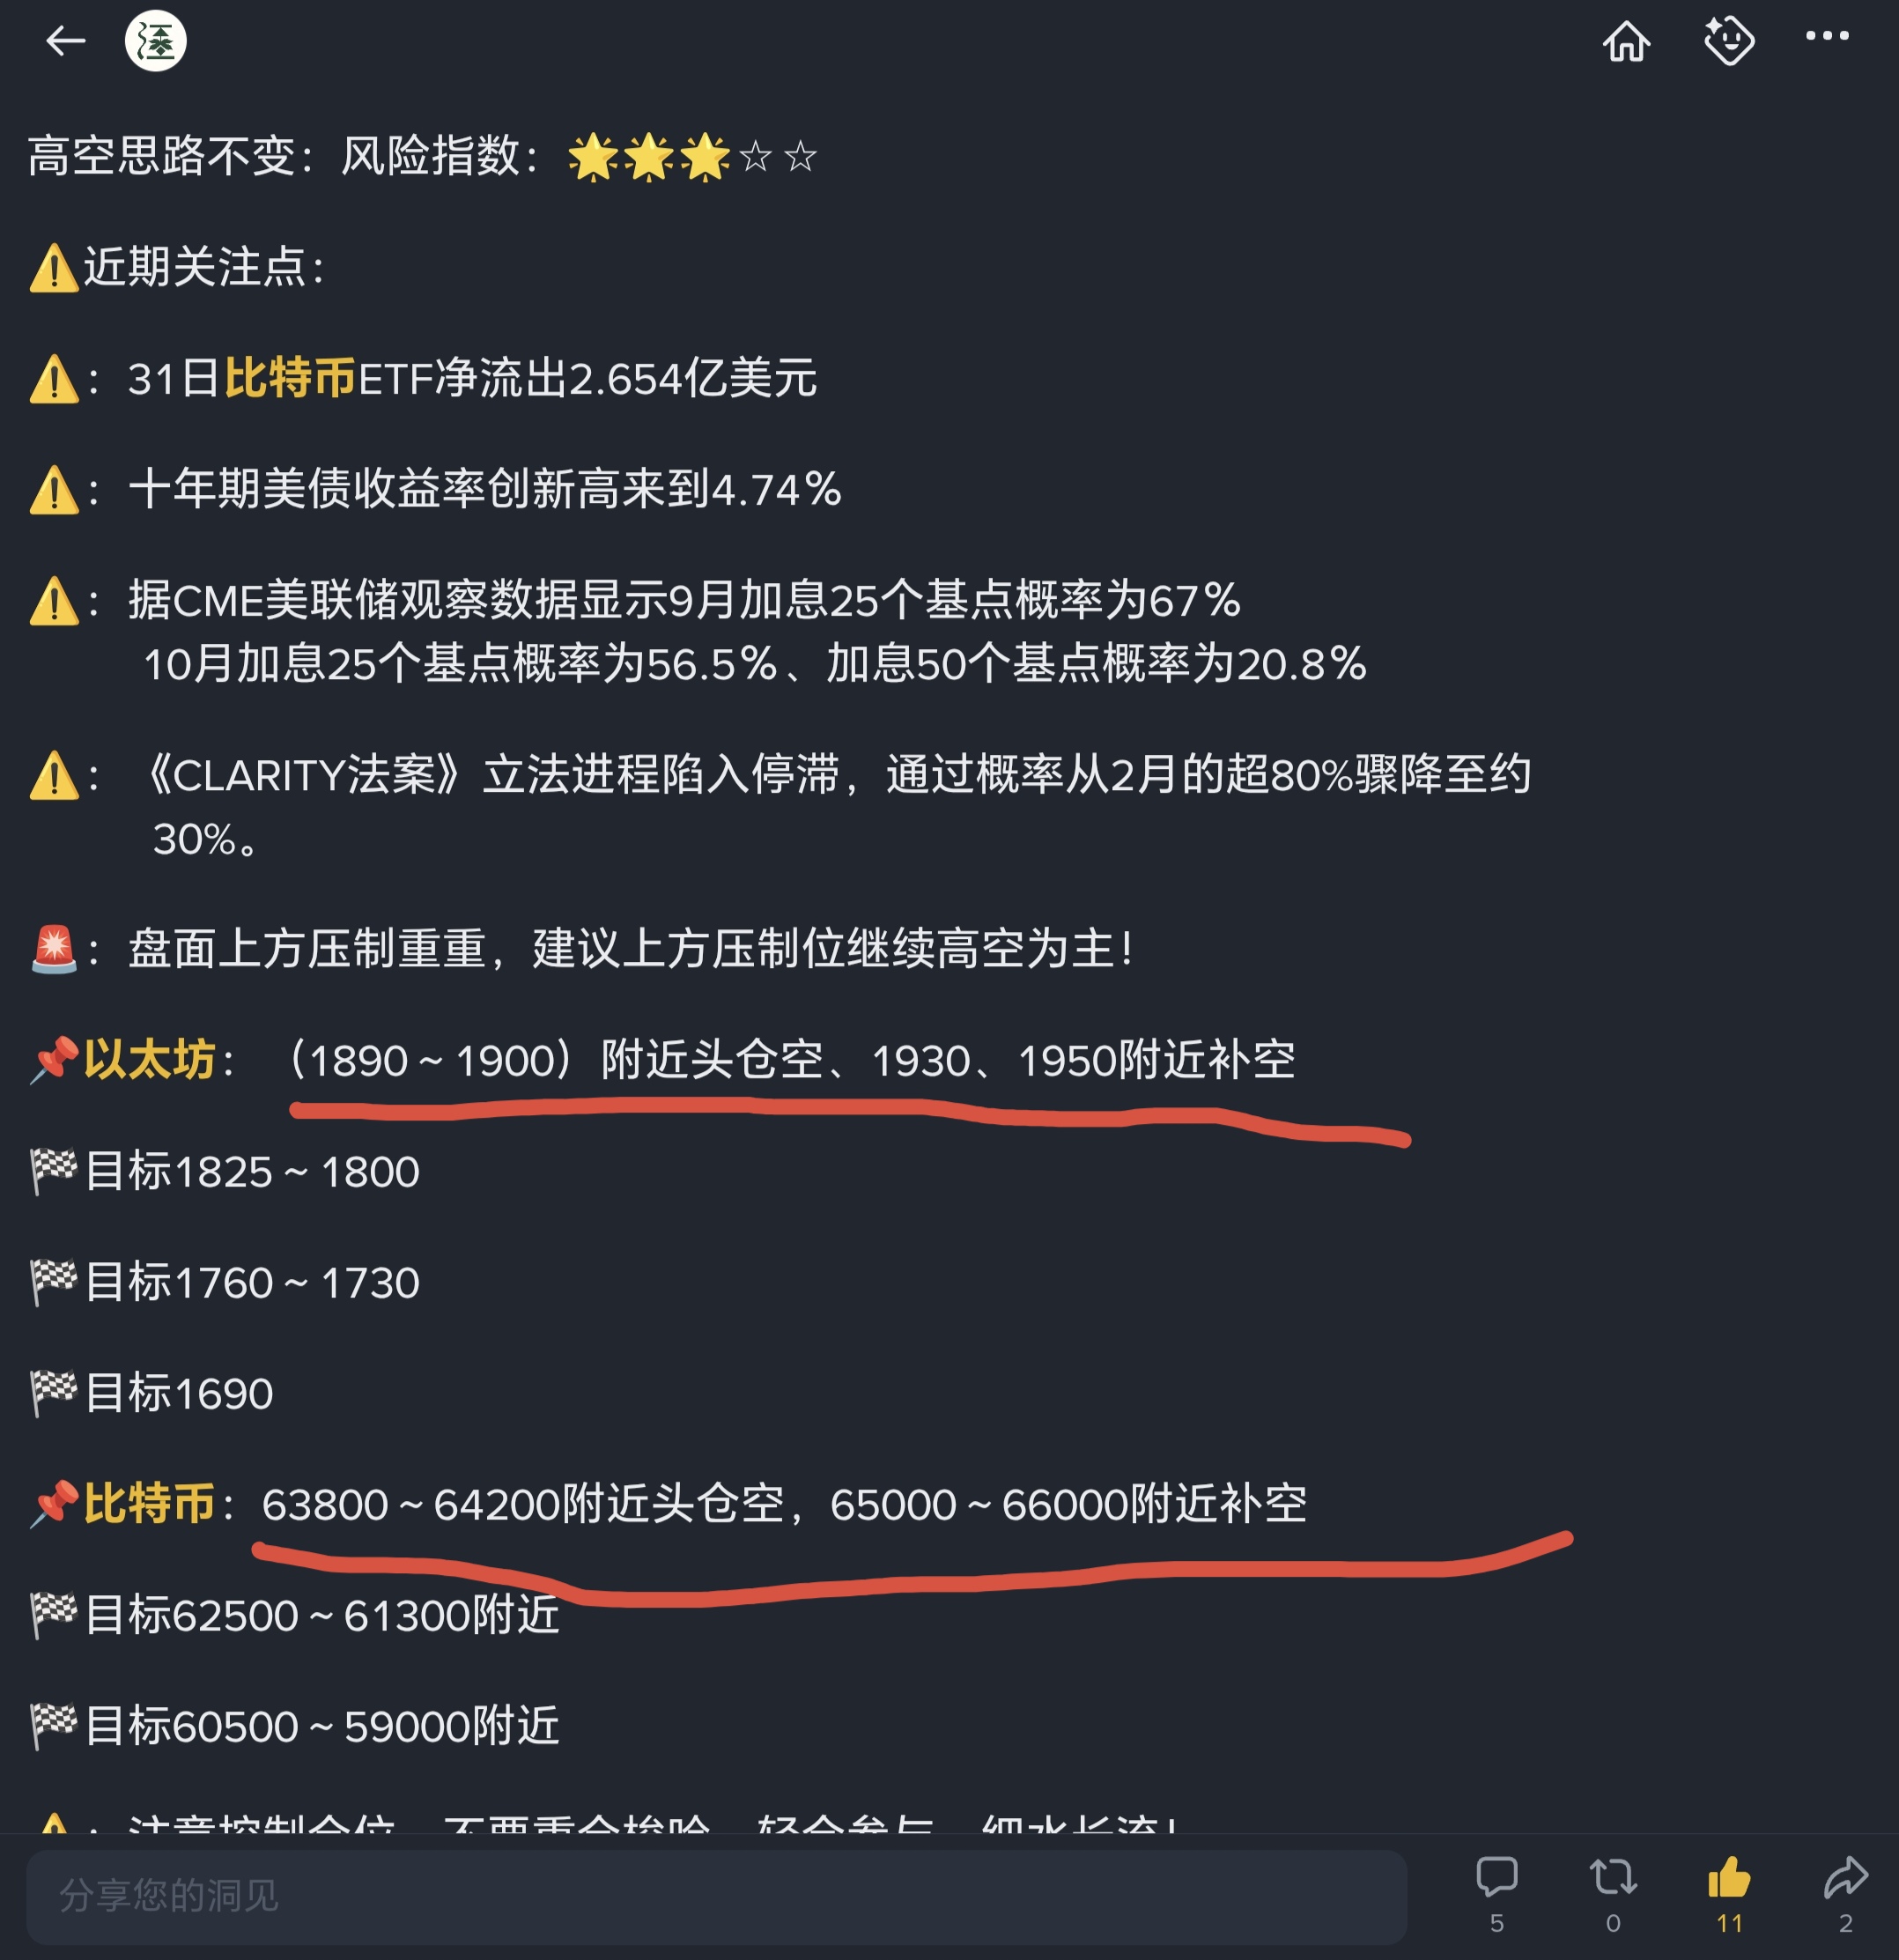
In yesterday's issue 20, a short position around Ethereum 1890–1900 was provided, which rebounded to 1898 before facing downward pressure again, reaching a low around 1850. A short position near Bitcoin 63800 was suggested, but the price only climbed to 63779 at its peak, which is a slight regret, entering 20 points late, with a low touching around 62745! (For friends who entered nearby, please pay attention to reduce positions as per the article.)
Recently, many brothers must have felt: when the price rises, they dare not chase; when it falls, they dare not buy. After consecutive declines, market sentiment has clearly cooled, and many begin to doubt: has crypto become obsolete? Will there be no more opportunities in the future?
In fact, real market opportunities often do not appear when everyone is optimistic, but rather when the market is most confused and fearful. So here’s the question: is it really a buying opportunity now? What signals do we need to wait for to confirm the true bottom?
Today, let's deeply analyze this together with Jiang Feng from three perspectives: halving cycle, macro, and on-chain data.
1. Halving Cycle Perspective: The bottom may be approaching, but time is still needed for confirmation.
Back in November 2025, when Bitcoin was around $110,000, Jiang Feng had analyzed the halving cycle and historical bull-bear patterns:
The peak of this cycle is $126,200 on October 6, 2025, while the true major adjustment low is more likely to occur in the latter half of 2026.
Therefore, starting from around $110,000, I have maintained that we should look for high-level opportunities during the rebounds rather than blindly chasing after increases. I was once labeled as a bear leader, but in fact, it was not that I only see bearish trends, but at that time, even the current market environment doesn’t allow for optimistic bullish outlooks!
Looking back now, the current market trend still largely aligns with my previous judgment on the release of cyclical risks. (See the pinned article for details.)
However, the most critical question now is: when will the bottom arrive? My view is that historical cycles still exist, and the mid to late 2026 is still an important observation window for the bottom.
However, due to changes in the macro environment this year, including fluctuating interest rate expectations, tightening liquidity, and decreasing market valuations, the cyclical bottom may form around October to November! Nevertheless, truly confirming the bottom cannot rely solely on price declines; it requires multiple indicators to validate jointly.
2. Why has BTC continued to face pressure recently?
1. Frequent changes in the Federal Reserve's interest rate expectations, leading the market to price in interest rate risks.
According to CME Federal Reserve observation data, market expectations for policy changes in September have notably heated up. Recent data indicates that the probability of rate hikes in the next two months has risen to about 66%-80%. If the market begins to trade on tighter expectations, risk assets will feel pressure in advance!
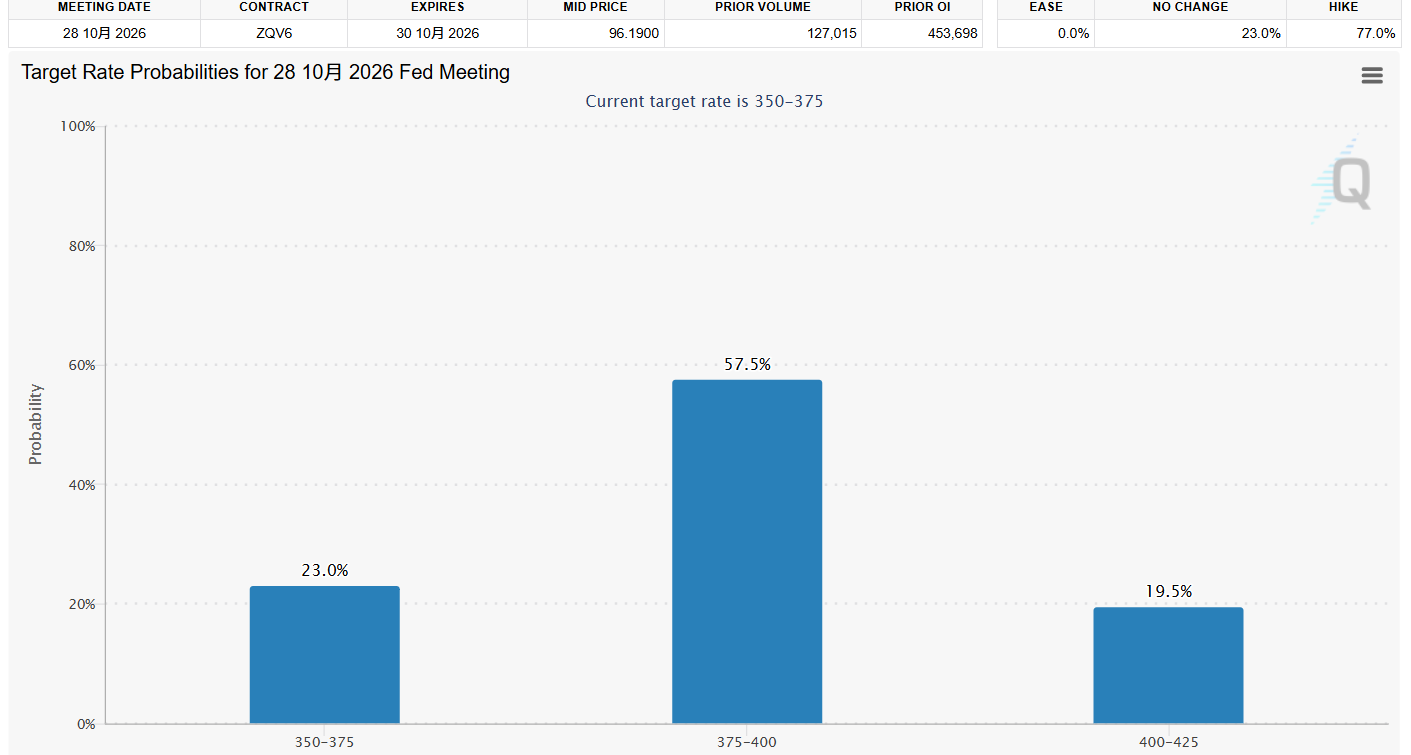
In fact, the final impact of whether or not to hike rates is not that significant, as I believe that the market often trades not on the event itself but on changes in expectations, which is the logic of "buy the expectation, sell the fact" that I have repeatedly mentioned! Therefore, if the tightening policy is truly implemented in the future, it might actually become a point of release for market sentiment, coinciding with the end of September, that is, around October to November, when a rebound could occur!
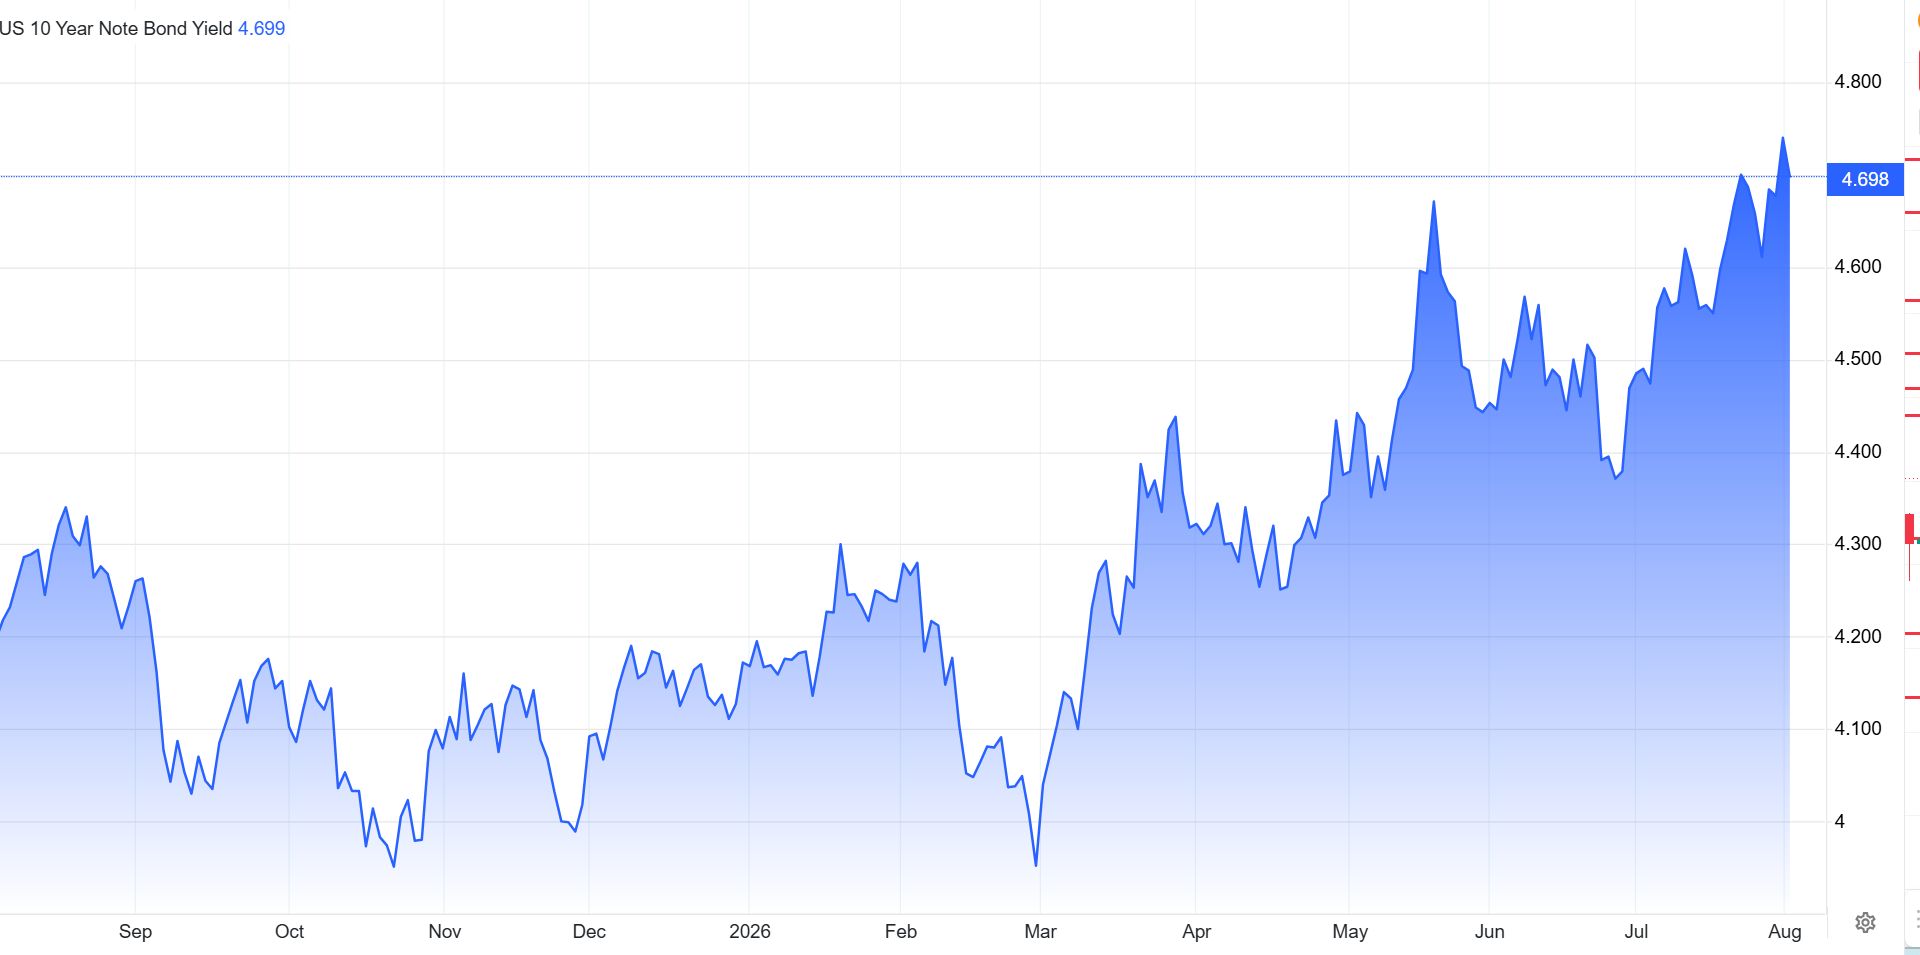
2. The continual rise in U.S. Treasury yields is suppressing the valuations of risk assets.
Currently, the yield on the 10-year U.S. Treasury bond has risen to around 4.7%. High yields mean that capital is more willing to stay in dollar-denominated assets rather than flow into high-risk assets. Thus, the recent BTC adjustment is not merely a technical correction; it's a reflection of macro liquidity pressure.
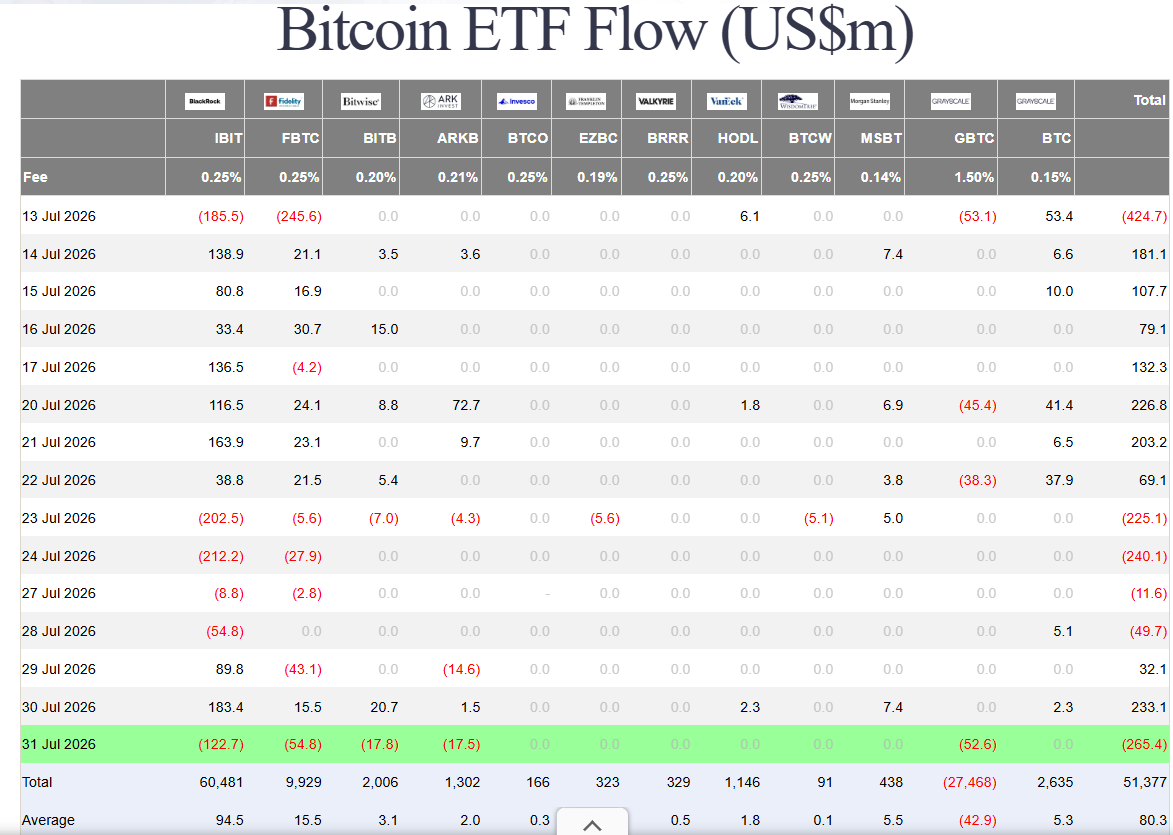
3. Outflows from ETF funds are weakening market buying pressure.
Data shows that on July 31, Bitcoin ETF saw a net outflow of about $265.4 million, which represents the attitude of institutional funds. Continuous outflows indicate a decrease in short-term risk appetite.
4. The policy expectations for the crypto market are cooling.
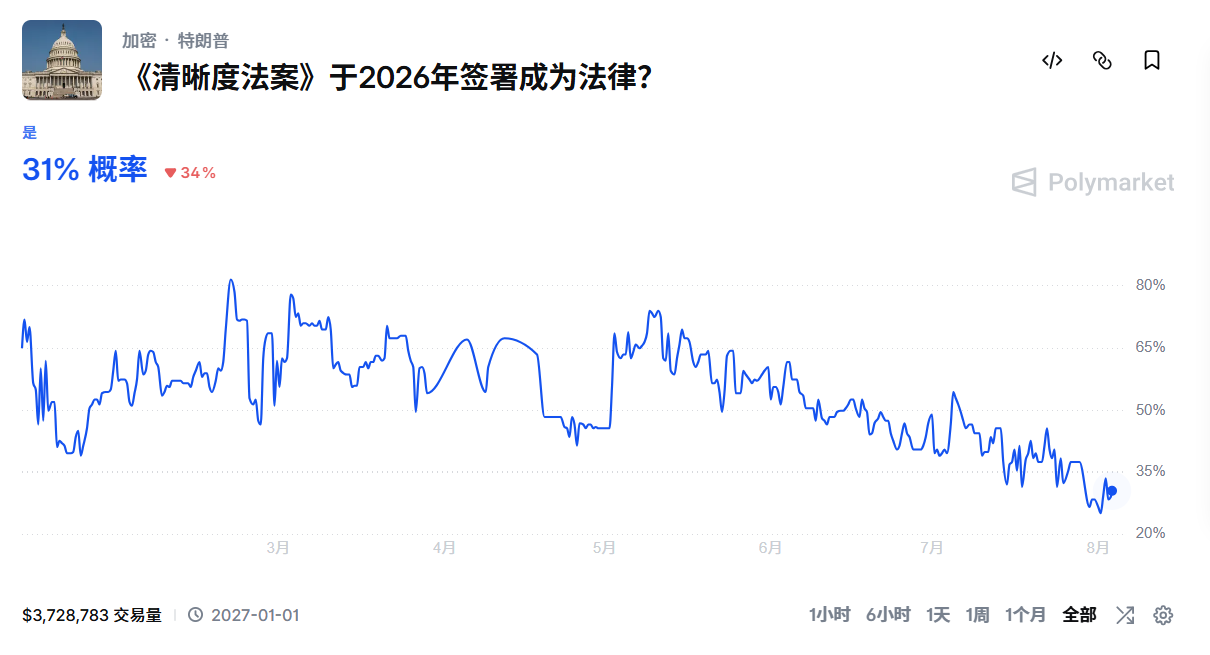
According to prediction market Polymarket data, the implied probability of the CLARITY Act being finally signed into law within 2026 is currently around 30%, significantly lower compared to the previous optimistic market period, reflecting increased uncertainty among investors regarding the legislative process in Congress.
3. Three on-chain signals to pay attention to for the true bottom
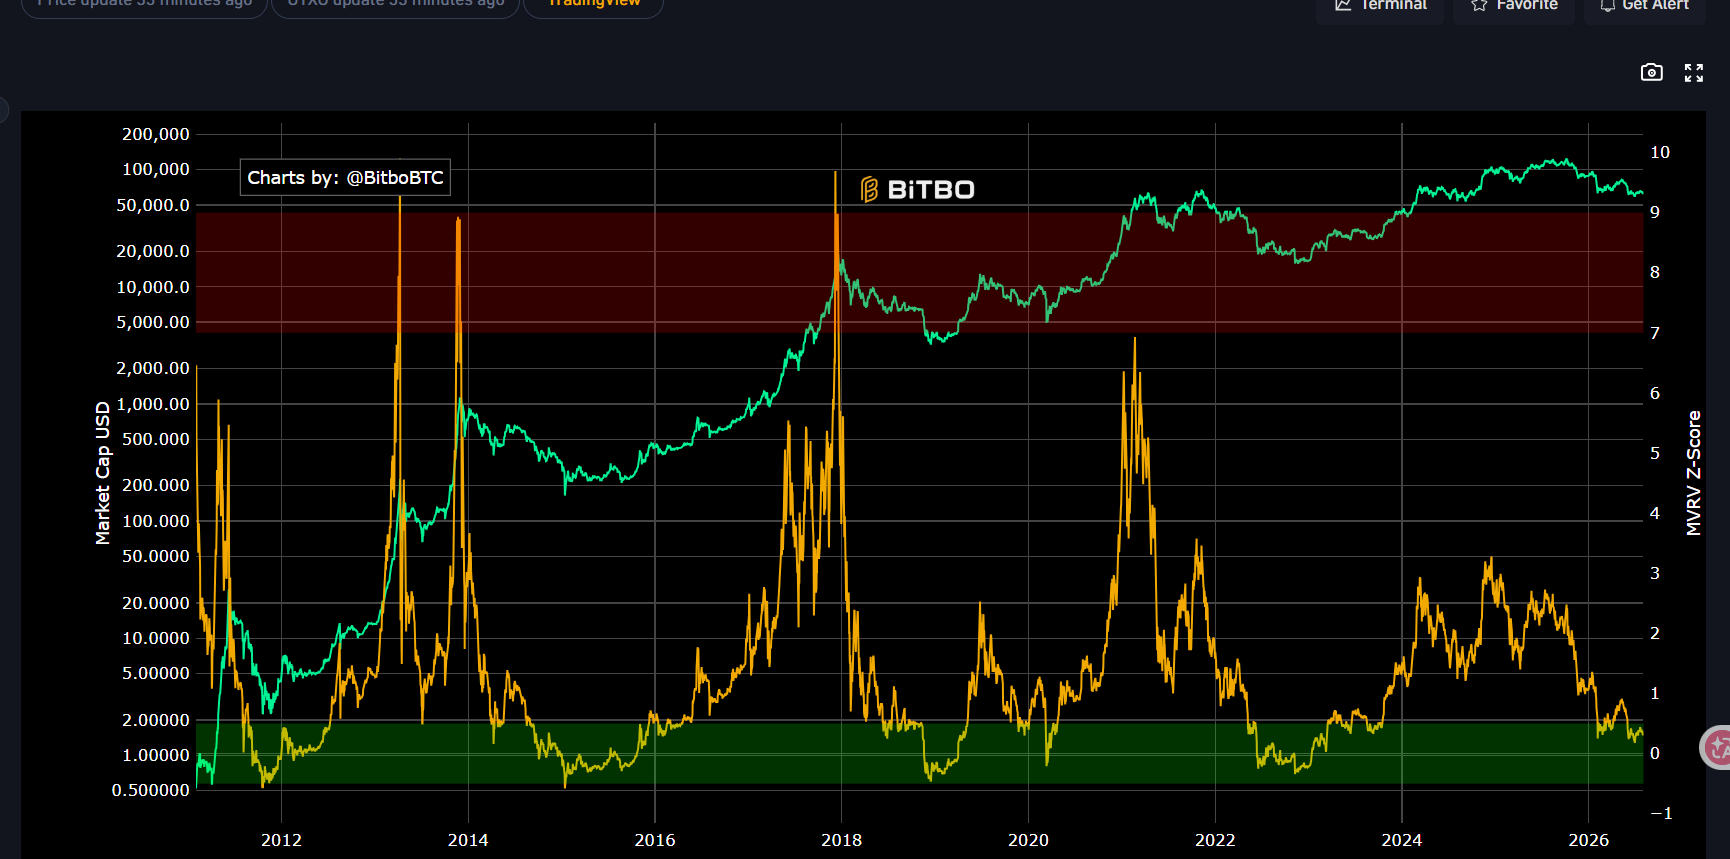
First: MVRV Z-Score
The current MVRV Z-Score is about 0.33. From the perspective of historical cycles, extreme bottom regions usually enter negative territory, such as around -0.3 to -0.5. Although the market valuation has clearly declined, it is still some distance away from the historically extreme panic areas; simply put: the market has become cheaper, but not to the extent that everyone is desperate, and often despair is where the opportunity lies!
Second: Puell Multiple
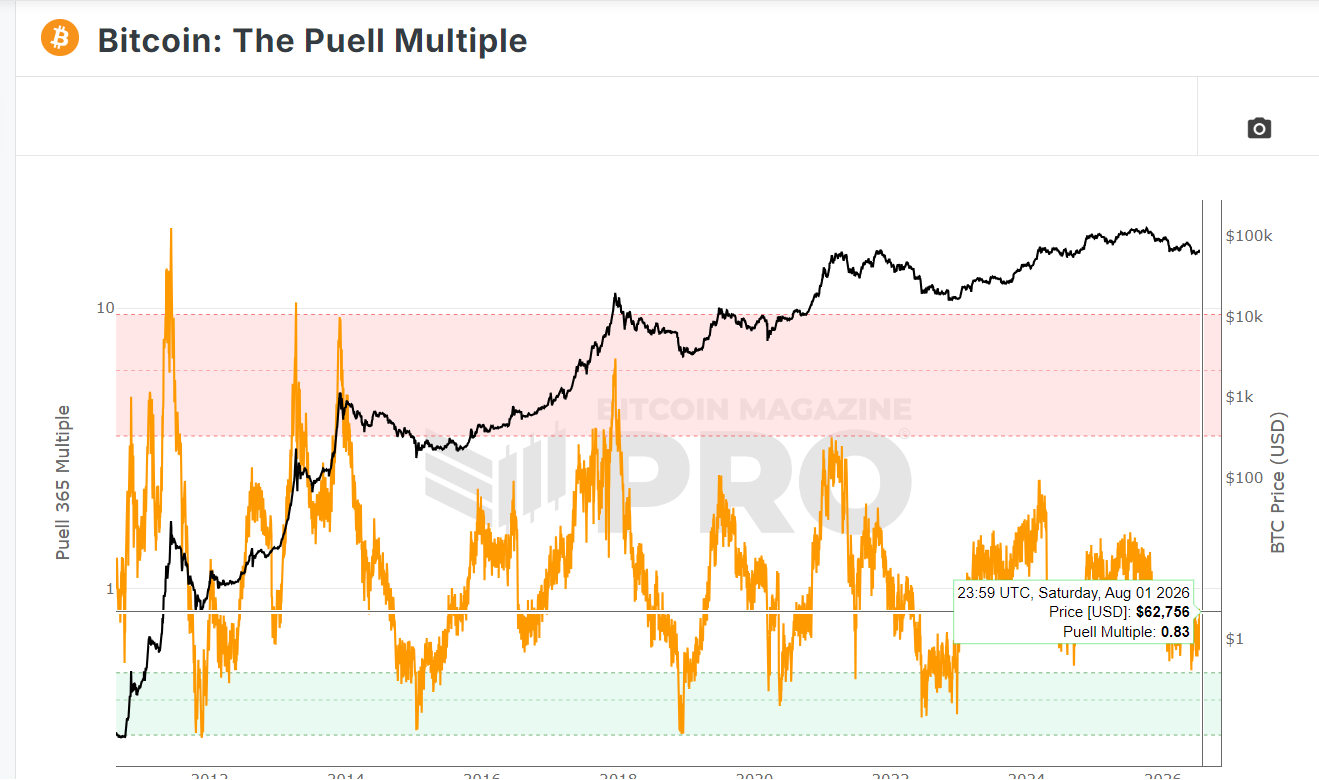
The current Puell Multiple is around 0.83. This indicator mainly observes miner revenue pressure, and historical bottom areas are often accompanied by large-scale miner capitulation. Although miner pressure is increasing now, it has not yet reached an extreme capitulation stage.
True major bottoms usually cannot be assessed by price alone; we need to observe alongside the appearance of sustained net inflows in ETFs, improvement in stablecoin liquidity, declining BTC balances on exchanges, and long-term holders stopping sales. When capital begins to flow back in, the probability of confirming a bottom will significantly increase. We are far from reaching that stage, so Jiang Feng believes that although we are getting closer to the bottom, true cyclical lows may still require patient waiting of about 2-3 months. I will continue to track the situation!
Current BTC/ETH trading strategy
Overall, the market is still in: macro pressure release stage + cyclical adjustment stage. Although we are getting closer to the bottom, now is not the time to blindly buy the dip.
For short-term trading, maintain a stance of primarily selling high during rebounds! For aggressive strategies, be cautious with light positions! Risk index 🌟🌟🌟☆☆
📌Ethereum: short initial position around (1870–1900), add to short at 1928, 1958
🏁 Target 1825–1800
🏁 Target 1760–1730
🏁 Target 1690
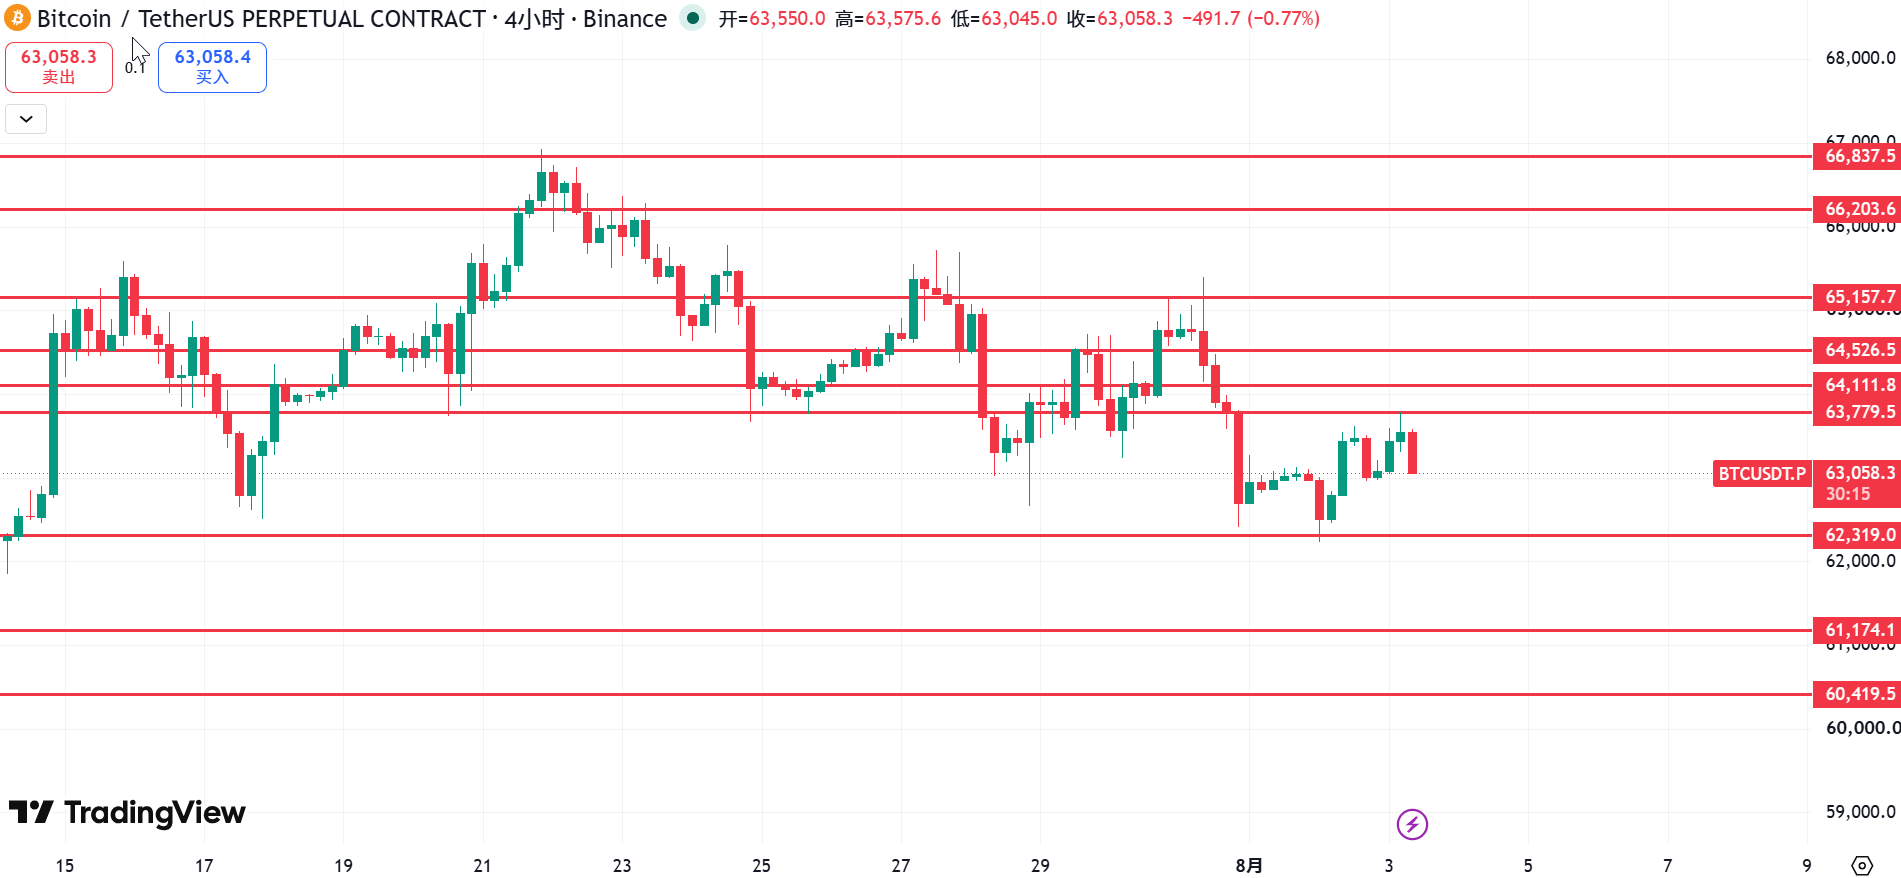
📌Bitcoin: short initial position around 63300–63800, add to short at 64200–65000
🏁 Target 62300–61300
🏁 Target 60500–59500
⚠️: Be careful with position control, avoid heavy bets, participate with light positions, and take it slow!
The most concerning aspect for everyone is the timing for buying the dip:
Wait for the market to present: 1. Macro expectations to turn 2. On-chain indicators to enter extreme undervaluation zones 3. Capital to flow back in; after these three signals resonate, I will lead everyone into a bullish position, and then we can consider a larger layout.
The market will never offer the best opportunities when everyone is optimistic; real big opportunities often arise from: fear, doubt, and even when no one believes it.
Jiang Feng understands your current situation: anxious, confused, lost, afraid of missing the buying opportunities, worried about missing out, fear of being caught if entering now; there’s no need to be so anxious. For those truly afraid of missing out, you can start small and gradually accumulate your spot (for those especially worried about missing out), and if the price indeed drops as I anticipated, you can add later! Ultimately, price going up is inevitable!
So there’s no need to be anxious about the present or worry about the future. After all, our lives encompass more than just trading, with vast landscapes waiting for us to explore!
In the 21st issue of Jiang Feng Trading Strategy Diary, I will continue to record every change in market cycles and will continually provide analyses of market logic. If you find this article helpful, please leave a mark to let me know you were here!
Written by: Jiang Feng Capital
K-lines and indicators are merely the results of price, not the reasons for the price.
Do you think the price will directly break 70,000 now? Or will it fall below 60,000? Feel free to discuss!

免责声明:本文章仅代表作者个人观点,不代表本平台的立场和观点。本文章仅供信息分享,不构成对任何人的任何投资建议。用户与作者之间的任何争议,与本平台无关。如网页中刊载的文章或图片涉及侵权,请提供相关的权利证明和身份证明发送邮件到support@aicoin.com,本平台相关工作人员将会进行核查。