Dear family members, the operational suggestions given internally yesterday include short positions in Ethereum at 1955 and Bitcoin at 65450, which have been revised repeatedly at high levels. Early this morning, there was a rapid decline, with significant profits being made from the short positions in Bitcoin and Ethereum, allowing us to exit all positions profitably.
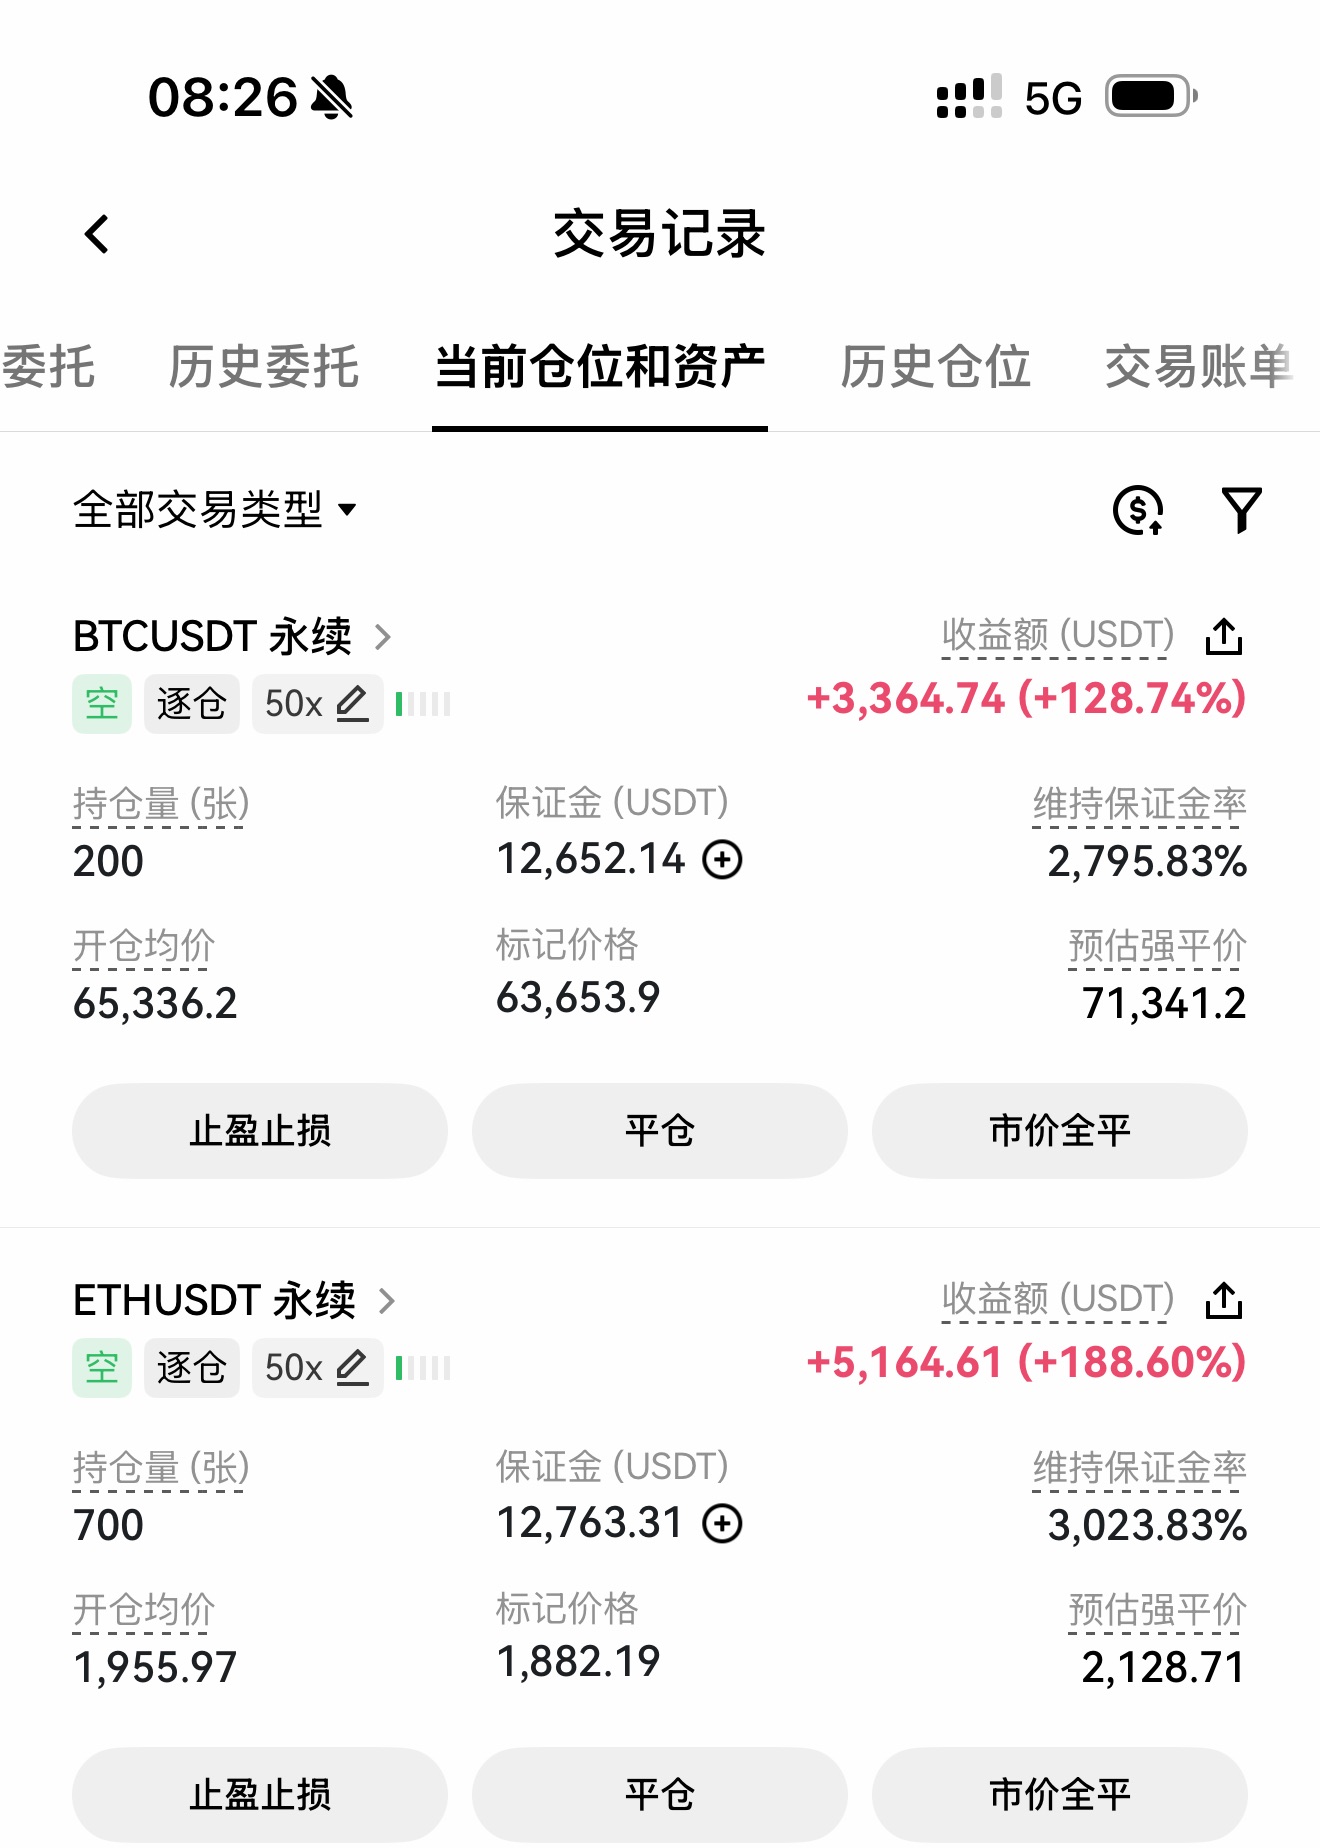
Ethereum (ETH)
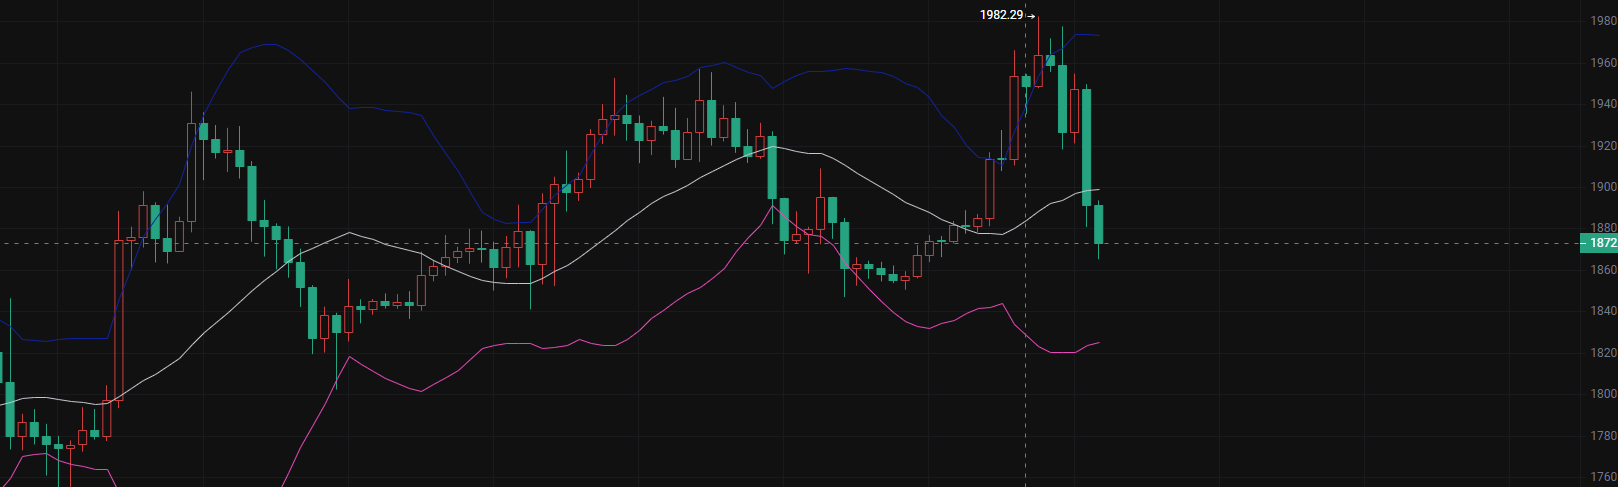
As shown, the three curves represent the upper, middle, and lower bands of the Bollinger Bands. This round of market trends has been operating within the standard wide Bollinger channel oscillation structure, and the oscillation pattern is very clear: the price has repeatedly tested the upper band and retreated under pressure, while falling close to the lower band has provided support for rebound, thus forming a complete cycle of "upper band under pressure, lower band supporting."
The price reached a high of 1982.29 in this round, continuing the historical pattern of touching the upper band and retreating under pressure. Yesterday, I informed internal members to lay out short positions around 1955, and today in the morning session, we successfully harvested 80 points of profit before exiting all positions.
The current price is 1876, which has fallen back to the lower edge of the middle band; after peaking at 1982, the market officially left the strong bullish area of the upper band and has dropped into the weak oscillating area between the middle and lower bands.
From the trading logic of the Bollinger Bands: if the price stabilizes above the middle band, it indicates a relatively strong pattern; if it effectively falls below the middle band, the middle band will directly shift from support to strong resistance. The short-term primary resistance zone is locked at 1895-1910 (around the middle band); if the market unfolds a corrective rebound, this zone will be the first major test.
In the short term, there is technical support around 1860 when the price falls, which is highly likely to trigger a wave of oversold rebound; however, considering the larger structure, this round is a deep correction after touching the upper band at a high level, and the nature of the rebound is primarily defined as a repair pullback during the downward process.
In other words, even if the support at 1860 holds and a rebound occurs, when the price tests the middle band at 1895-1910, the probability of facing pressure and falling again is high. In the later market, we focus on observing the key support line at 1840:
If the support at 1840 holds effectively, the oscillation structure of the Bollinger channel will continue, and the market will maintain a wide oscillation; If the support at 1840 is effectively broken by an entity bearish candle, it means that the long-term Bollinger oscillation box is completely broken, the downward space will further open up, and a deeper adjustment will be initiated.
Practical operational suggestions and risk warning: these are only technical deductions, not mandatory trading suggestions. All operations must strictly set stop-losses and control positions.
1. Short-term long strategy (betting on the rebound at 1860 support)
Wait for the price to backtest the support line at 1860, and consider going long in the short term only after the K-line shows a stop-loss signal (long lower shadow K-line, small rising K-line).
Short-term target: 1890~1895 (near the middle band region);
Stop-loss: exit if it effectively falls below 1840.
Important reminder: this trade is only for a short-term rebound. Once it reaches the pressure zone near the middle band, do not linger; take profits in time and do not look for long-term bullish positions.
2. Short-term short strategy (layout when rebound is under pressure)
Wait for the market to repair and rebound, and when the price reaches 1895-1910 at the middle band pressure zone, if a stagnation pattern occurs (long upper shadow, turning bearish K), layout short positions accordingly.
First target looks towards 1860; the mid-term target observes the key support at 1840;
Stop-loss: abandon the bearish strategy directly if the closing price stabilizes above 1930.
3. Response plan for critical breakouts
① Downward breakout: if the price directly falls below 1860, and the rebound is weak, do not rush to catch the bottom; wait for a rebound near 1860 to be under pressure, then follow through with short positions, seeing 1840 as a test; if 1840 is broken, continue with the bearish mindset.
② Upward reversal: if the market strengthens above the middle band at 1910, it indicates a repair of the weak structure; pause the bearish mindset, and switch to a low-buying mindset.
The current market is in a weak transitional period after a significant drop from a high level, and the overall pattern is leaning towards weak oscillation. Trading should prioritize waiting for signals at key support and resistance levels before entering the market, avoiding chasing peaks and cutting losses. The main feature of oscillating markets is back-and-forth washing, and patiently waiting for prices to reach target zones and confirming K-line shapes will increase the profit-to-loss ratio and avoid risks from intraday price spikes.
Bitcoin (BTC)
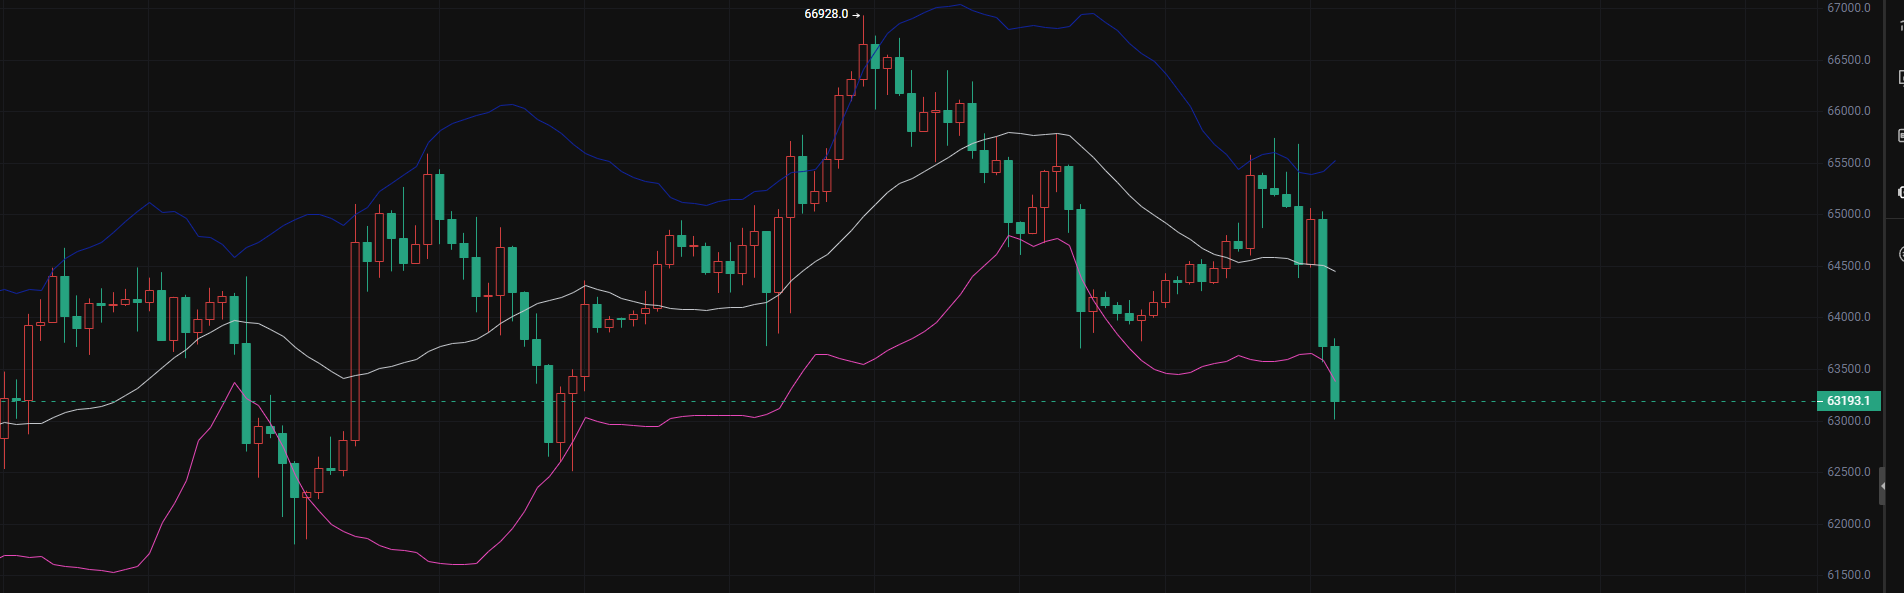
As shown, during this phase of the previous bull market peak, the market running rules are very clear: the price has been continuously strengthened relying on the middle band of the Bollinger Bands, repeatedly testing the upper band under pressure and falling back, then falling close to the middle/lower band to gain support for rebounds, maintaining a standard Bollinger channel oscillation uptrend until this round reached the high point of 66928.
After the price touched the peak of 66928, the bullish momentum was completely exhausted, and the K-line could not sustain above the upper band of the Bollinger Bands, initiating a phased downward trend. The current price is 63193, and the price has effectively fallen below the middle band, formally entering the weak operating interval between the middle and lower bands.
The core rule of the Bollinger Bands: if the price stabilizes above the middle band, it indicates a bullish environment; once it falls below the middle band, the middle band will shift from support to strong resistance. The immediate resistance zone above is set at 64400 — 65000 (around the middle band).
In the short term, there is first-phase support in the 62800~63000 area. If the price falls back to this range, it is likely to generate a technical repair rebound; however, from the overall K-line structure, this round of decline is a correction after touching the upper band at a high point, thus subsequent rebounds are primarily classified as repair pullbacks during the decline.
In simple terms: even if the support around 63000 holds and a rebound occurs, when the price tests the middle band at 64400-65000, the probability of facing pressure and falling again is significant. In the later market, focus on the key support line at 62000:
✅ If the 62000 support holds, the wide oscillation structure of the Bollinger channel will continue, and the market will maintain back-and-forth adjustments;
❌ Once 62000 is effectively broken by a major bearish candle, it means the adjustment space after this round of upward movement will be further expanded, the oscillation structure will be damaged, and deeper downward space will open up.
1. Short-term rebound betting strategy (short long)
Wait for the price to backtest the support zone of 62800-63000, and consider attempting short-term long positions only after a stop-loss signal appears (long lower shadow, small upward K-line).
Short-term target: 64300~64800 (near the pressure area of the middle band);
Stop-loss: exit if it effectively falls below 62000.
Important reminder: this is only for betting on an oversold repair rebound. Once it reaches near the pressure area of the middle band, do not hold for the long term; take profits promptly and do not look for bullish reversals.
2. Follow-through short strategy (layout short positions under pressure)
Wait for the market to repair and rebound upward, and when it touches the 64400-65000 pressure zone of the middle band, if a stagnation K-line shape appears (long upper shadow, turning bearish K), layout short positions accordingly.
First target looks to 63000 support; mid-term observe the key support at 62000;
Stop-loss: abandon the bearish strategy directly if the closing price stabilizes above 65500.
3. Extreme breakout response plan
① Downward breakout: If the price continues to weaken, falling below the 62800 support and the rebound is weak, do not blindly catch the bottom; wait for a slight rebound to encounter pressure near 62800 and then follow through with short positions, focusing on testing the 62000 support; once 62000 fails, continue with the bearish mindset.
② Upward reversal: If the market continues to have strengthening bullish candles above 65000, it indicates a repair of the short-term weak structure; pause the bearish thinking, and shift back to a stronger oscillation pattern, focusing on buying on dips.
BTC has formed a structure under pressure at the upper band of the Bollinger Bands at the 66928 high, and after falling below the middle band, the short-term pattern has shifted to a weak oscillation. Currently, it is in an adjustment period after a significant drop from the high and trading should avoid chasing peaks and cutting losses, patiently waiting for prices to reach key support/resistance positions, and confirming K-line formations before entering to increase the profit-to-loss ratio and reduce risks from oscillating volatility.
Public account — Bitcoin Big Bear X
(Note: 📣 Due to the timeliness and depth limitations of information on public platforms, the market changes rapidly. Key turning points, precise operational strategies, and sudden risk alerts need to be synchronized on the public account in real time. Here you can receive: real-time strategy updates, in-depth analysis support, interactive Q&A, and risk warnings and optimization suggestions for personal positions. 🚨 Remember: the market always rewards those who act faster and have more accurate information! Be a winner among the minority.)

免责声明:本文章仅代表作者个人观点,不代表本平台的立场和观点。本文章仅供信息分享,不构成对任何人的任何投资建议。用户与作者之间的任何争议,与本平台无关。如网页中刊载的文章或图片涉及侵权,请提供相关的权利证明和身份证明发送邮件到support@aicoin.com,本平台相关工作人员将会进行核查。


