The weekly RSI has finally formed a clear bullish divergence.
Written by: Duo Nine YCC
Translated by: Baihua Blockchain

For nearly a year, we have been waiting for a clear bullish signal from Bitcoin, and now, we may have finally gotten it. The weekly RSI has shown a clear bullish divergence.
This does not mean we have completely exited the danger zone, as lower lows could still occur. Nevertheless, this is a positive signal worth noting, and it suggests that this bear market may be nearing its end. Let's take a closer look.
I have been waiting for this signal from Bitcoin all year, and now it has finally arrived. The weekly RSI has finally formed a clear bullish divergence.
Take a look at the image below.
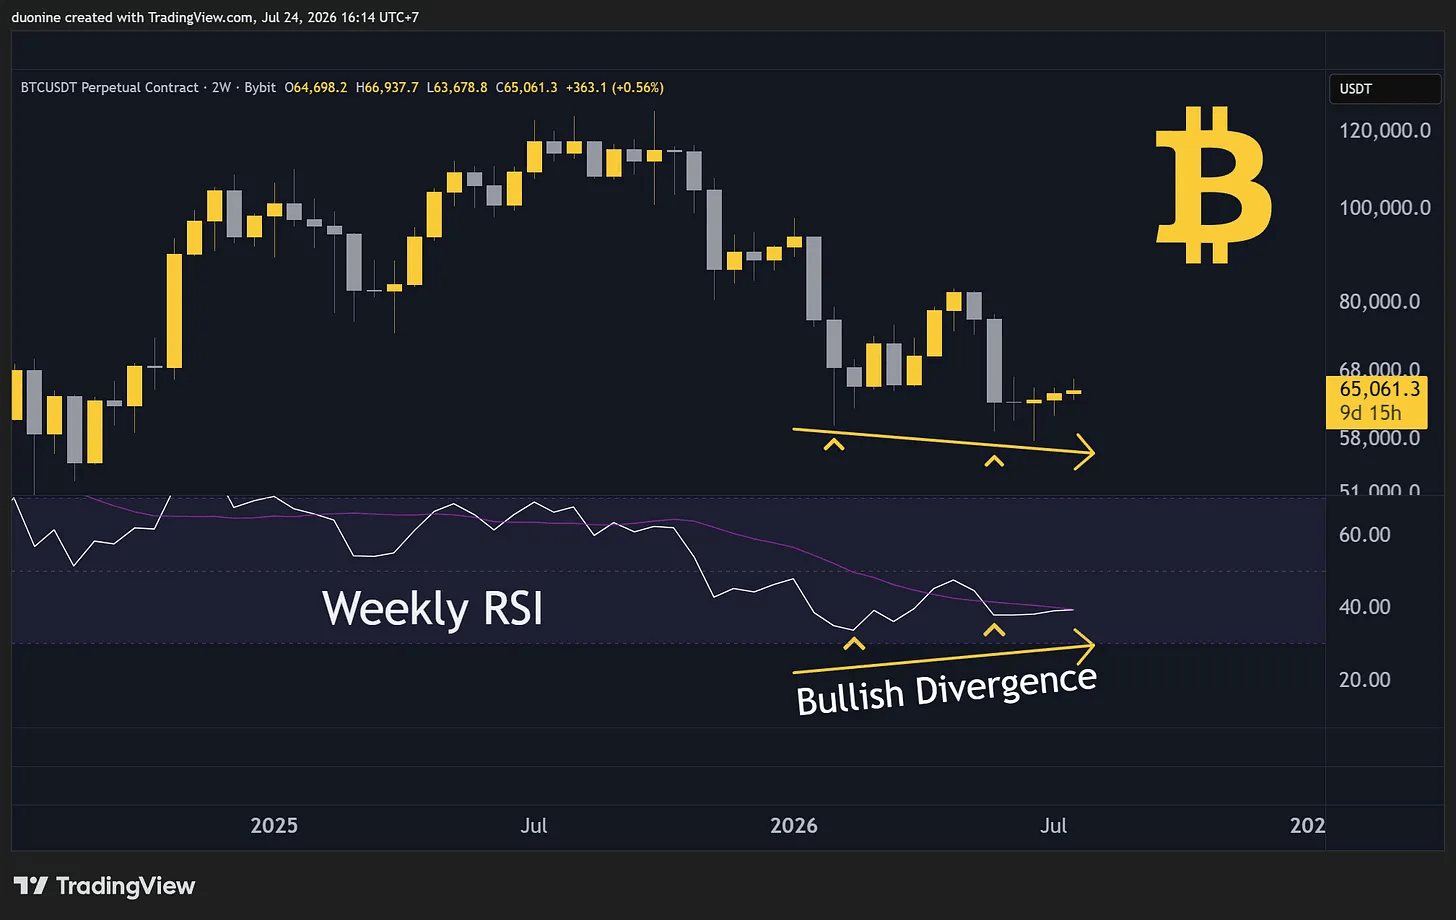
As you can see, while the price has made lower lows, the RSI has created higher lows. If you are looking for a bottom for Bitcoin, this is exactly the signal you want to see.
To confirm that this bullish divergence is valid, you need to see Bitcoin's price make higher highs (above $82,000), or at least produce a higher low (around $60,000). If this trend occurs, market confidence in the "bottom is in" will strengthen.
However, I think it is still a bit early to assert that $58,000 is the ultimate bottom.
This is because bullish divergences often take months to fully materialize. During this period, the price may continue to make new lows, and the RSI may further confirm this bullish divergence.
Therefore, I will not rule out the possibility of another decline in the future.
If that indeed happens, it is likely to be a good buying point, as this pattern often drives buying pressure, leading BTC into a sustained uptrend. A more likely timeframe for this could be around the end of 2026.
Additionally, having just one indicator with a bullish tilt is not enough on its own.
You also need to see a resonance between price movements, trading volume, and momentum.
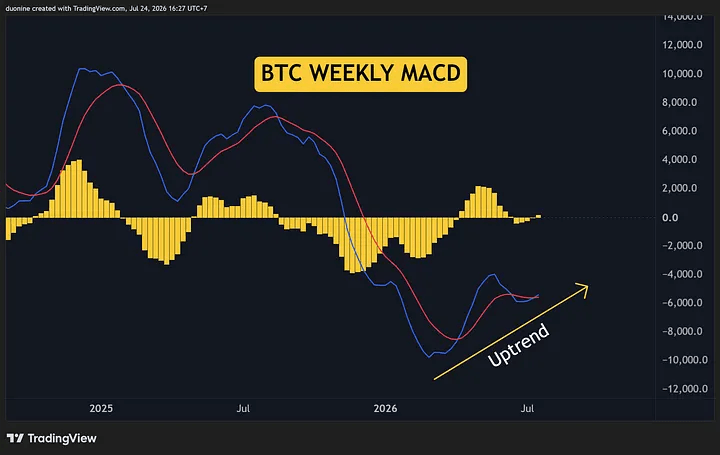
From a momentum standpoint, the weekly MACD is performing well, showing a clearer rising low (left side of the image below). But if we switch to the monthly timeframe (right side of the image below), the MACD is still bearish, and the histogram remains relatively flat; although it may start to bend upwards, it is still too early to make a conclusion.
So, what is still lacking now?
First, Bitcoin's current price action is still weak. At the time of writing, the price is around $65,000, but for this macro downtrend to come to an end, prices must advance further upwards. At least in the short term, this does not seem likely to happen.
Second, the volume structure has not confirmed a bottom. Typically, whether at a top or bottom formation, trading volume will be accompanied by a very significant spike in volume. Looking at the daily trading volume chart from Coinbase below, I did not see such a volume spike at the $58,000 level.
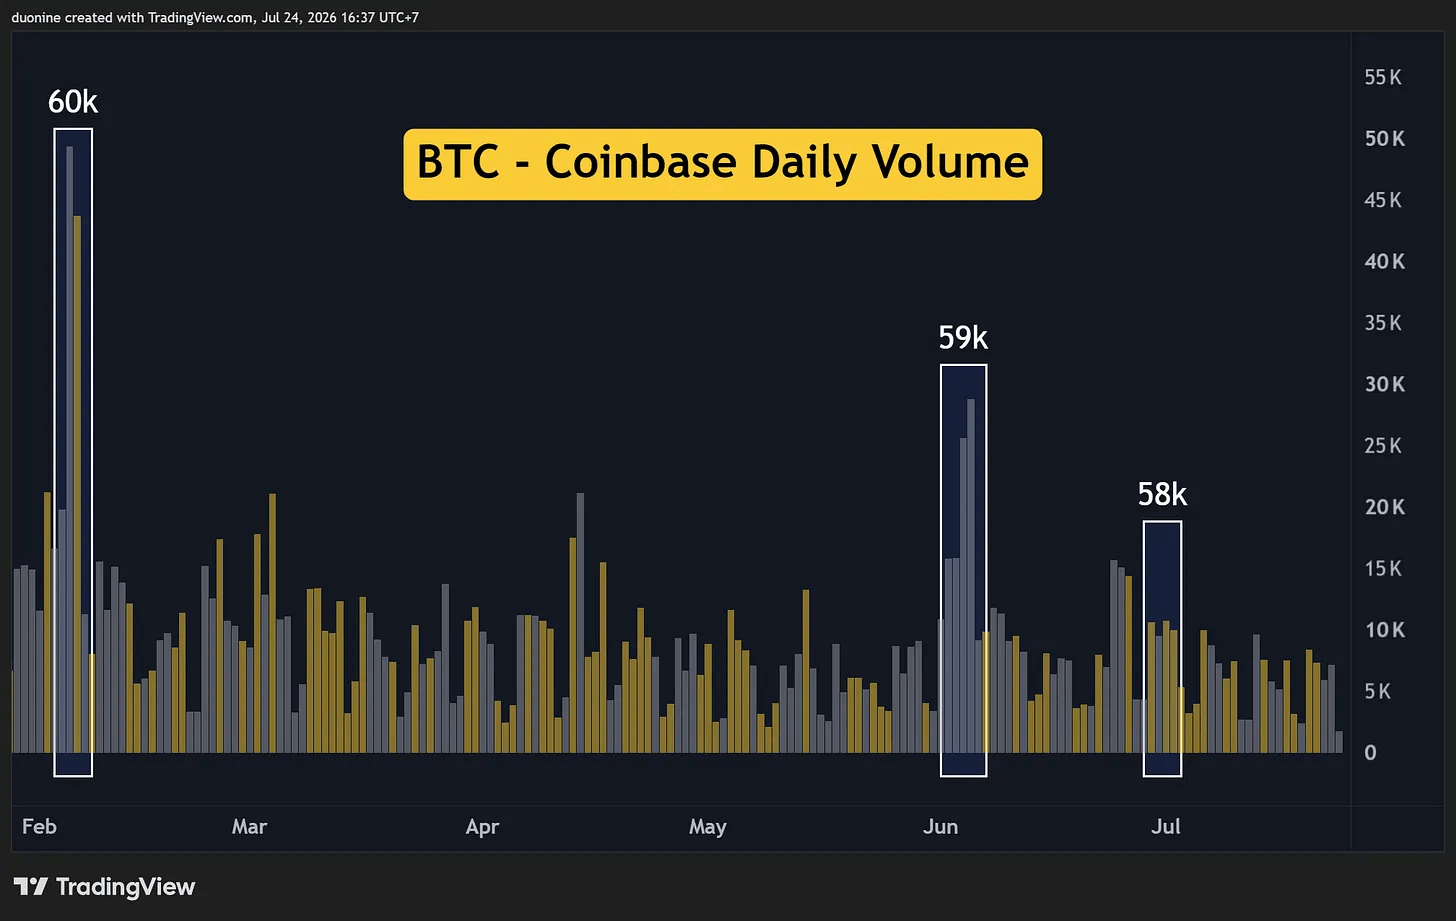
On the contrary, the drop to $58,000 happened in a low-volume environment. Although buying pressure continued to flow in afterwards, there was no significant volume explosion. From historical experience, volume is often a good bottom indicator, but I do not see that characteristic in this chart. This makes me think of two possibilities:
The bottom has not really appeared; it is still ahead;
This cycle is indeed different.
I do not agree with the idea that "this cycle is different", because people said the same when discussing the four-year cycle. As a result, Bitcoin still fell sharply around the same time.
That said, the probability of Bitcoin making another lower low is still significant, and it could even just slightly drop below $50,000. By that time, volume might significantly increase, helping us see a clearer bottom, while also forming another bullish divergence confirmation point on the weekly RSI.
If it comes to that, I would choose to buy and not continue waiting for more bullish signals, as that would seem overly greedy. As I mentioned earlier, even if we do not eventually see lower lows later this year, I will start to accumulate in batches after October, regardless of the price at that time.
If you miss Bitcoin by insisting on waiting for a specific price, you will feel very upset when it rises again and breaks through $100,000. And this is very likely to happen in 2027. A better approach would be to start dollar-cost averaging before the end of this year; if the market declines again, then continue buying.
免责声明:本文章仅代表作者个人观点,不代表本平台的立场和观点。本文章仅供信息分享,不构成对任何人的任何投资建议。用户与作者之间的任何争议,与本平台无关。如网页中刊载的文章或图片涉及侵权,请提供相关的权利证明和身份证明发送邮件到support@aicoin.com,本平台相关工作人员将会进行核查。


