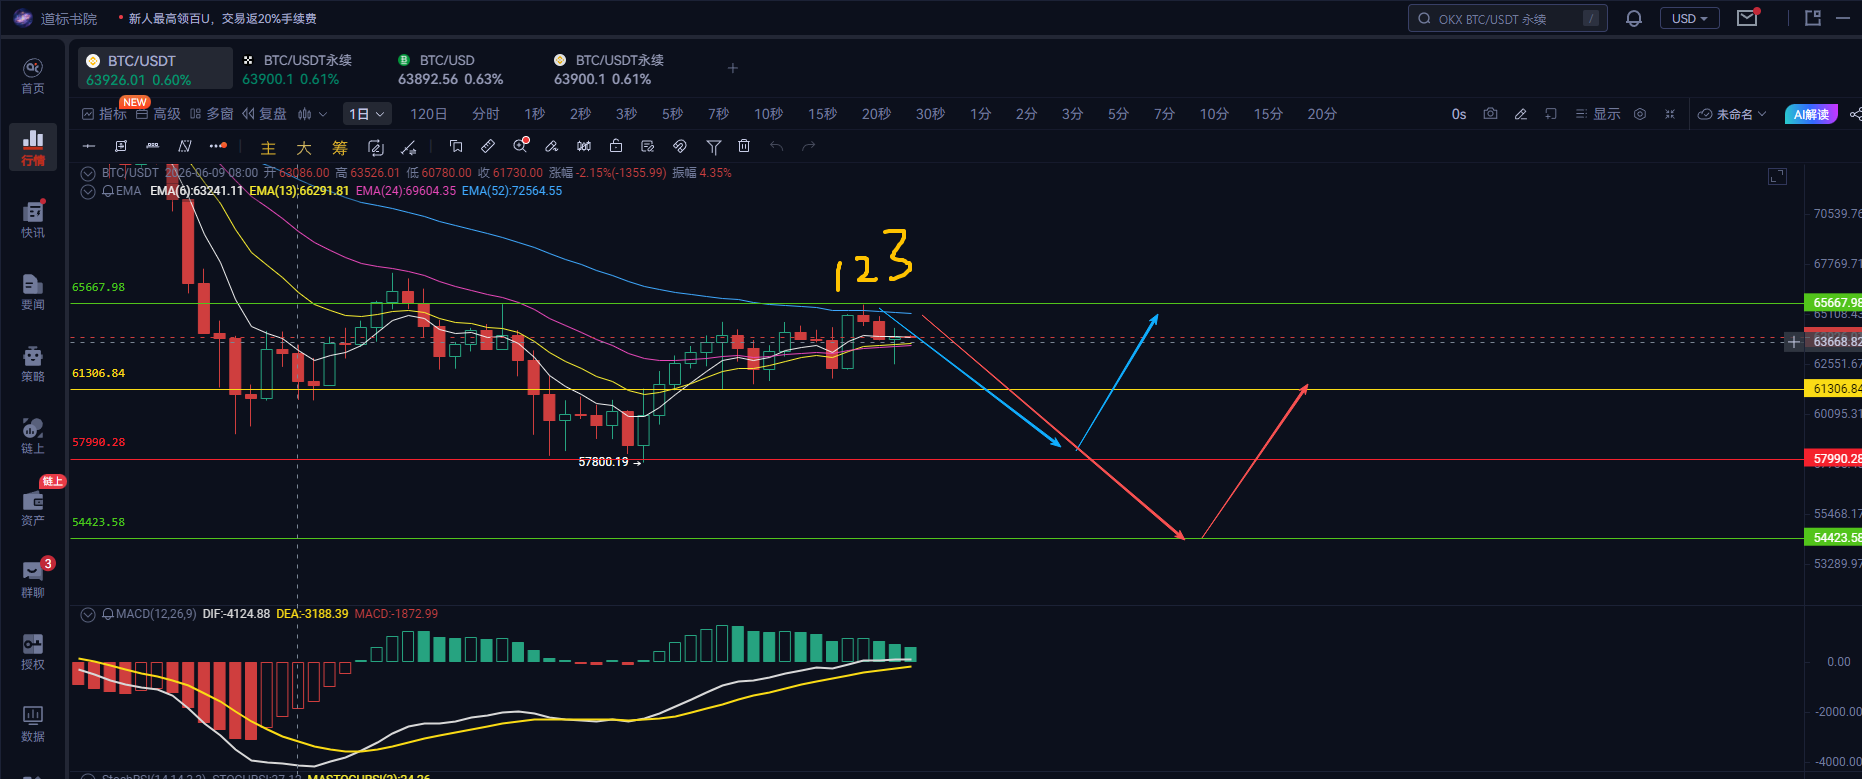
First, starting from the current highest point on the daily chart (Binance spot price) 65600, which is the highest point, on the daily chart
In the last three days, a topping pattern has already appeared. Here, the next movement on the daily chart can go in two directions: one is the blue path, where the next move on the daily chart does not break 57800. In the range between 65600 and 57800 on the daily chart, it will continue to move sideways in a consolidation phase. The second movement is the red path, where the next move on the daily chart directly breaks 54800, so the next important support level will be 53000-54000 US dollars.
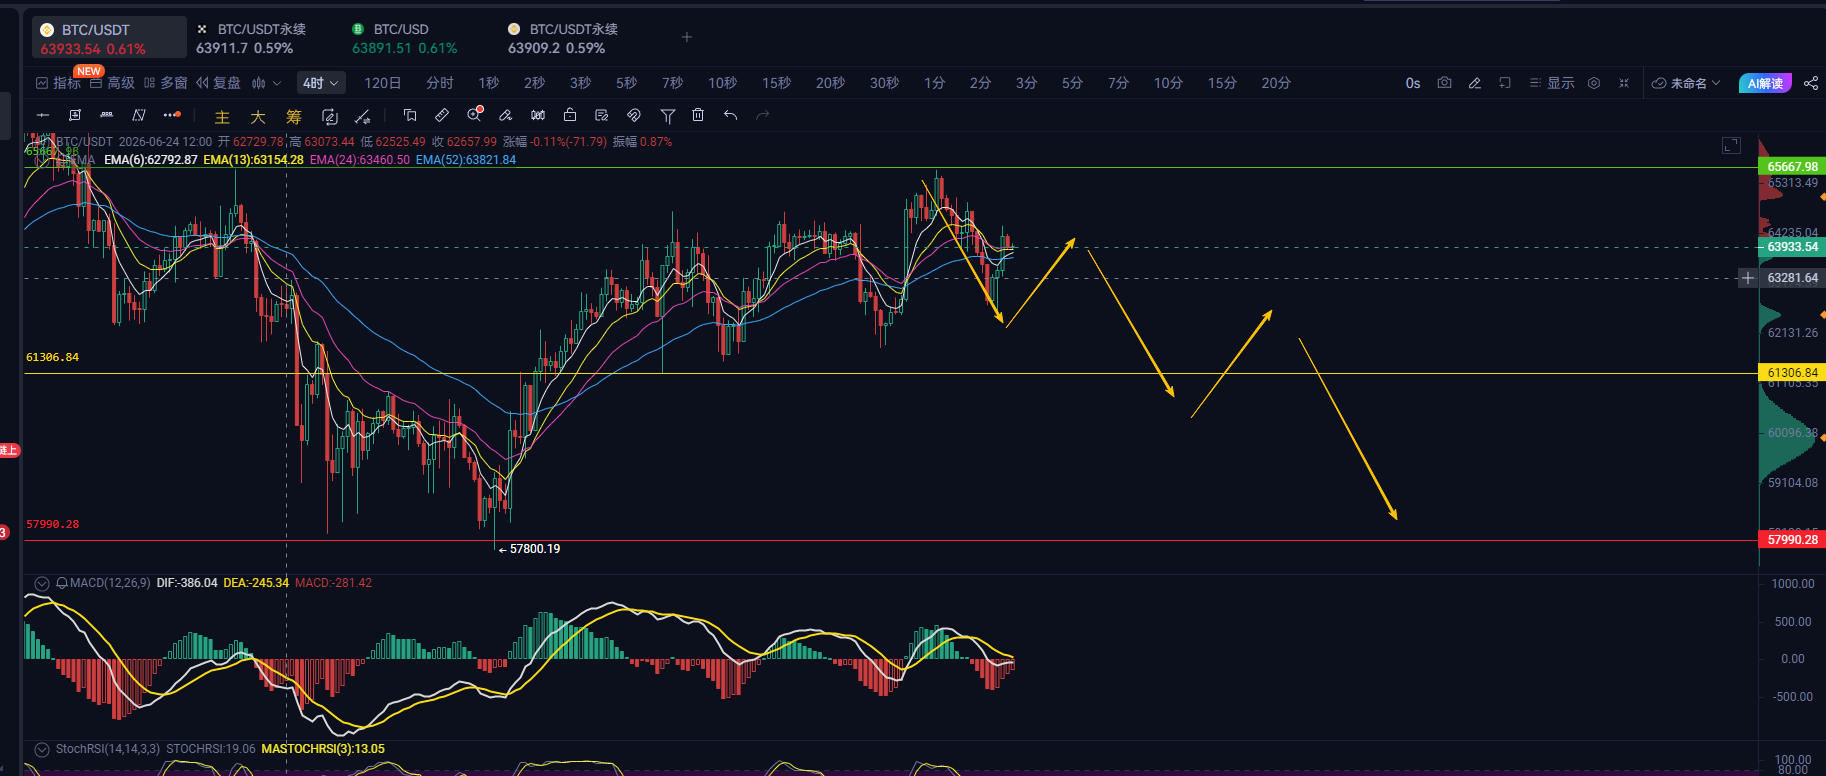
Switching to the 4-hour chart, the current highest point on the 4-hour chart, 64387.99, can serve as the stop-loss level. As long as there is no effective breakout, the next probability is the yellow structure movement, with 64387.99 as the effective stop-loss level, betting on a downward movement on the daily chart. The downward movement on the daily chart usually lasts about 10-15 days, so the time window for downward movement and the rebound turning point for long positions can be focused on the 25th and 28th, the time for long position rebounds. If the 4-hour high of 64387.99 is effectively broken, then the overall logic will be invalidated. Next, the trading plan should be adjusted again, observing the market dynamically. This is my personal view, for reference only, not investment advice.
A professional trader for 7 years, focusing on the cultivation of trading psychology. If you are interested in my articles, feel free to follow the public account "Dao Biao Academy," with the same name online.

免责声明:本文章仅代表作者个人观点,不代表本平台的立场和观点。本文章仅供信息分享,不构成对任何人的任何投资建议。用户与作者之间的任何争议,与本平台无关。如网页中刊载的文章或图片涉及侵权,请提供相关的权利证明和身份证明发送邮件到support@aicoin.com,本平台相关工作人员将会进行核查。