Trump announces the restart of the "Iran" blockade policy, imposing a 20% cargo protection fee on all ships passing through the Strait of Hormuz, leading to a sharp rise in crude oil futures. The rising risk of war combined with higher oil prices enhances the market's concerns about inflation and further Fed rate hikes.
Additionally, all major U.S. stock indices closed in the red on Monday. The cryptocurrency fear and greed index is expected to drop to 22 today, indicating extreme fear, marking the most pessimistic market sentiment in nearly a week. It is crucial to focus on the latest CPI data to be released tonight at 20:30, which will lay the groundwork for future trends.
Bitcoin hit a low of $61,810 in the past 24 hours, and as of the time of writing, it is priced at $62,719, with a decline of 2.13% in the last 24 hours. Ethereum is also weakening, with a low of $1,747, and as of the time of writing, it is priced at $1,796, with a decline of 2.02%.
One-hour Bitcoin chart
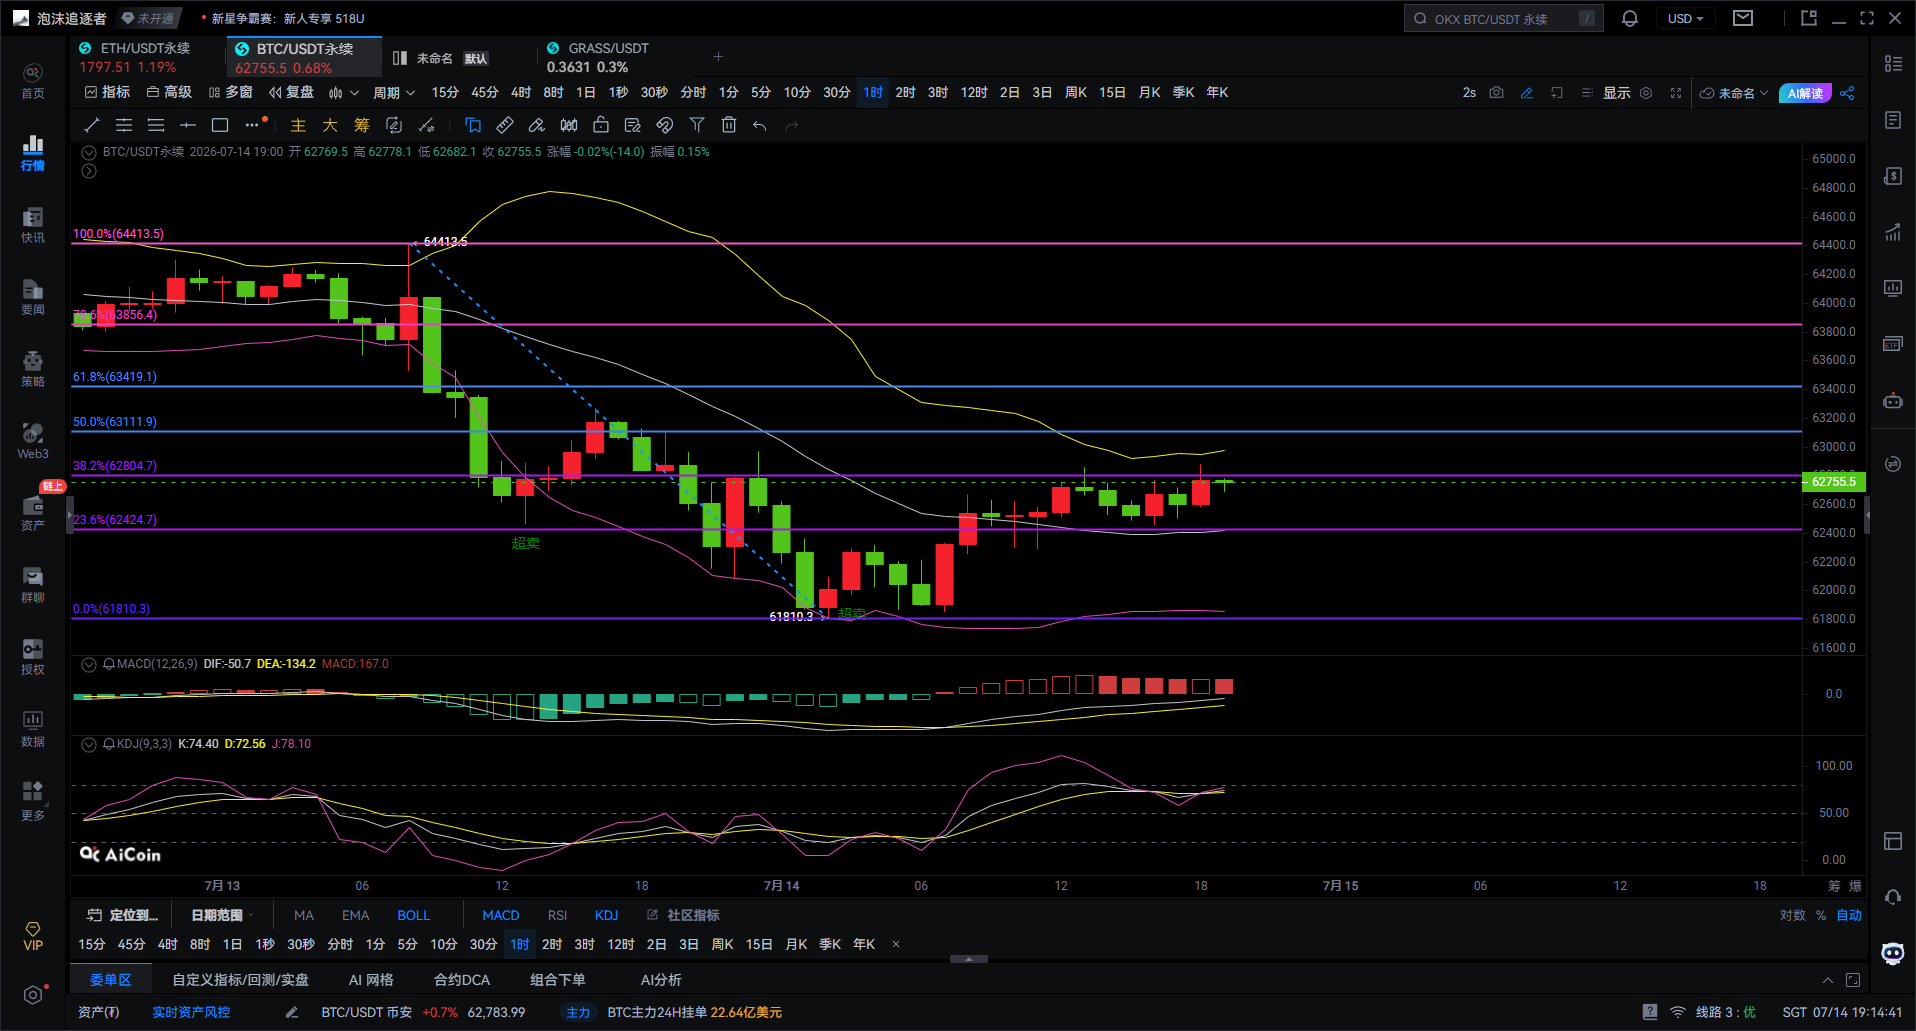
1. Overall trend: This wave of Bitcoin has fallen from $64,413 to $61,810 and is now starting to rebound. The current price is around $62,755. I feel that the market has shifted from a one-sided decline to a consolidation and recovery phase, but it has not yet formally entered an upward trend.
2. The MACD currently shows several notable changes: DIF is starting to converge towards DEA, and red momentum bars have appeared consecutively, but the length of the red bars is shortening. What does this indicate? I believe that the strongest phase of the bears has passed, and the market is stabilizing. However, the shortening of the red bars also means that the upward momentum is weakening, making short-term fluctuations likely, without a direct surge. If there is a golden cross in the MACD with increasing volume later, then the upward space will truly open up.
3. The KDJ shows that K is at 74, D is at 72, and J is at 78, all above 50. This indicates that the bulls are still dominant in the short term. However, the J value has reached a relatively high level, and the three lines are starting to converge. This structure generally indicates that there is still inertia for upward movement, but chasing highs comes with risks. Next, we need to see if it can diverge upwards again.
4. The price has regained its position above the middle Bollinger band. The lower band is starting to flatten, the middle band is bending upwards, and the upper band is still pointing downwards. This indicates that the market has moved away from the weakest phase, but the Bollinger band has not yet opened up again. Therefore, I tend to think this is a consolidation rebound, not a trending upward movement. A genuine strength shift requires the middle band to continue rising, the upper band to reopen, and the candlestick to stabilize near the upper band.
5. The Fibonacci retracement has currently bounced to around 38.2%, which is $62,805, representing the first significant resistance. There are further resistances at 50% ($63,112), 61.8% ($63,419), and 78.6% ($63,856). Thus, the range from $62,800 to $63,400 is the largest pressure zone for this rebound. If it breaks above 61.8%, the market will have a chance to challenge the $64,400 area again.
Forecasting future market trends
First scenario, with a higher probability of about 60%. The price continues to fluctuate upwards but may easily encounter resistance around $63,100 to $63,400 initially, then retrace to $62,500 and $62,300 to confirm support before rising. I think this is the healthiest path.
Second scenario, with a probability of about 25%. If there’s a volume breakout above $63,420 and MACD shows a resurgence of volume with KDJ diverging again, then the market continues to look towards $63,850, $64,400, or even challenges the previous high.
Third scenario, with a probability of 15%. If it falls below $62,300, the rebound will end, and the market may retest the support around $61,800.
Trading strategy
I will not chase long positions around $62,700. I will focus on two positions. First, long position opportunity: stabilize on a retrace to $62,400 to $62,500, or follow up after a volume breakout staying above $63,100. Second, short position opportunity: if there is a volume stagnation above $63,100 to $63,400, MACD red bars continue to shorten, and KDJ shows a death cross, then consider light positioning for a pullback.
Summary in one sentence
I believe Bitcoin has entered a repair rebound phase, but the most critical short-term resistance zone is $62,800 to $63,400. MACD shows weakening bearish momentum, KDJ is still leaning bullish, and BOLL is in recovery, overall leaning towards a range-bound strength. In terms of trading, I prefer to buy low and not chase highs, waiting for a confirmation signal after breaking above $63,100 or retracing after $62,400 before following the trend.

It's better to give you a correct mindset and trend than to give you a guaranteed suggestion; teaching fishing is better than giving fish; advice can earn a moment, but the mindset learned can earn a lifetime!
Time of writing: (2026-07-14, 19:14)
(Article by: Da Xian speaks on currency) This is to declare: Publication on the internet has delay, the above suggestions are for reference only. Investment carries risks; enter the market cautiously!
免责声明:本文章仅代表作者个人观点,不代表本平台的立场和观点。本文章仅供信息分享,不构成对任何人的任何投资建议。用户与作者之间的任何争议,与本平台无关。如网页中刊载的文章或图片涉及侵权,请提供相关的权利证明和身份证明发送邮件到support@aicoin.com,本平台相关工作人员将会进行核查。