Author: Jake Pahor
Compiler: Deep Tide TechFlow
Deep Tide Guide: A valuation model that has tracked Bitcoin's 12-year history has just been reconstructed. The new model shows the current reading at 24.3, within the lowest 20% range historically—however, during previous bear markets, this number has fallen below 20 when a true bottom was reached. Either this time is different, or the real washing out has not yet come. For those looking to buy the dip, this is an uncomfortable but worth-watching signal.
Two weeks ago, I told you that Bitcoin was in the bottom 3% range of its entire history. Today that score reading is 24.3, bottom 20%.
The market has not moved 17 points. It is the model that has changed. Rather than quietly updating a number and hoping no one checks, I would rather explain clearly what has actually happened.
Because here's the thing: If you're going to make real money decisions based on a score, you have the right to know when it changed and why it changed. This is the difference between a system and a sales pitch.
Why the score moved but the market did not
Our old model had a flaw, one we had long known about. It compared today’s price to the entirety of Bitcoin's history, including the early days when BTC could swing thousands of percentage points over the course of months. That kind of volatility will never repeat. Because they are included in the benchmark, the score will quietly read low and can no longer touch the top of its own range. Useful, but drifting.
The rebuilt model (v4.1, now live) measures the price's position within a fair value range that projects forward with the asset, rather than being anchored to 2012. The same 0 to 100 scale. The same work. A better ruler. We validated it against 21 manually labeled cyclical tops and bottoms in Bitcoin's history, and it identifies these points with about 35% greater accuracy than the old model. I'm not going to go through the full methodology in the newsletter, but we've published a layman's version on the website because a score that you can't question is just a feeling with numbers.
So what does the new ruler actually say?
This is where it gets interesting, and honestly a bit uncomfortable.
Since 2014, every Bitcoin bear market has ended in this model in the same way: the score spends a significant time below 20 before the turn. The bottom in 2015 printed around 7. The bottom in December 2018 printed around 15. When the price low in November 2022 was $15,742, the score reading was 18, and it spent several weeks around 20 and below before and after that.
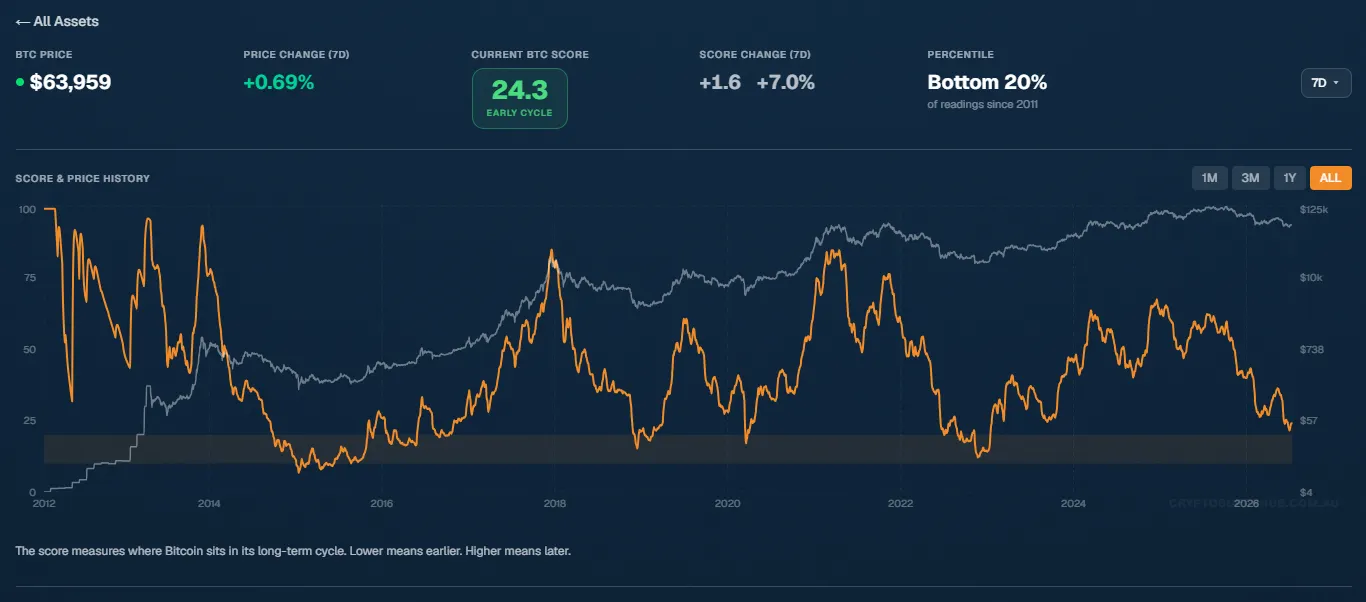
The lowest print of this cycle so far: 21.5, on July 1, with BTC at $58,550.
Close. But not there yet.
You can interpret this any way you like, but my honest interpretation is this: By the standards of every previous cycle, we have not yet seen the kind of washing out that historically marks the end. That is one possibility. Another possibility is that this cycle remains shallower, just like every preceding cycle has been shallower than the last. Our top print score for October 2025 is 59, far from the past crazy periods' readings above 74. A compressed top could mean a compressed bottom. The past cannot predict the future, and I won’t pretend the model is a crystal ball. It is a map of where we are, not a prediction of where we are going.
What I actually did, because a score without decision-making is just decoration:
I bought on July 1. Not because I called the bottom (I don't know what the bottom is; nobody knows). But because my plan had a trigger set at that price, and the trigger activated. It felt like an ordinary day. The score printed the cheapest reading of the entire cycle, and my phone didn’t ding once. The real accumulation zone feels like this: boring, quiet, slightly nauseating.
I also kept a large chunk of capital, with its deployment schedule written into my plan, tied to score levels rather than bound to how I felt that day. If the score printed below 20, my plan would buy more aggressively. If it did not break 20 and the market turned regardless, my regular DCA had already given me a position. In either case, I don’t need to be right. I just need to follow what I wrote when I was calm.
The rebuilt score is now live in the app, along with historical data, so you can check every statement I just made against the charts.
CSH Risk Dashboard
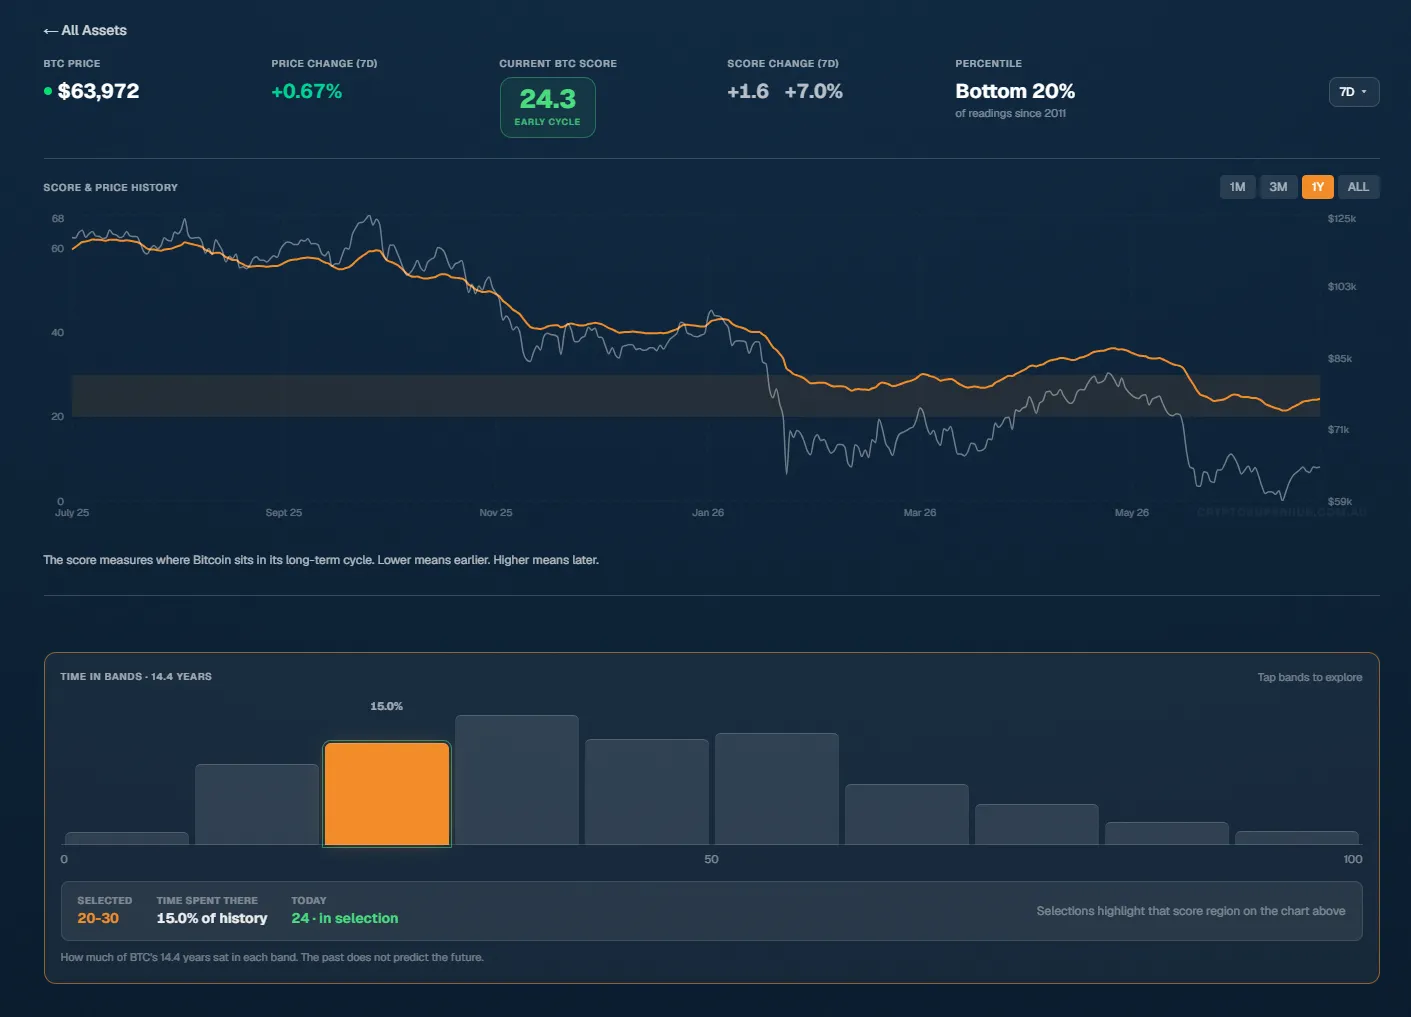
As of tonight's numbers:
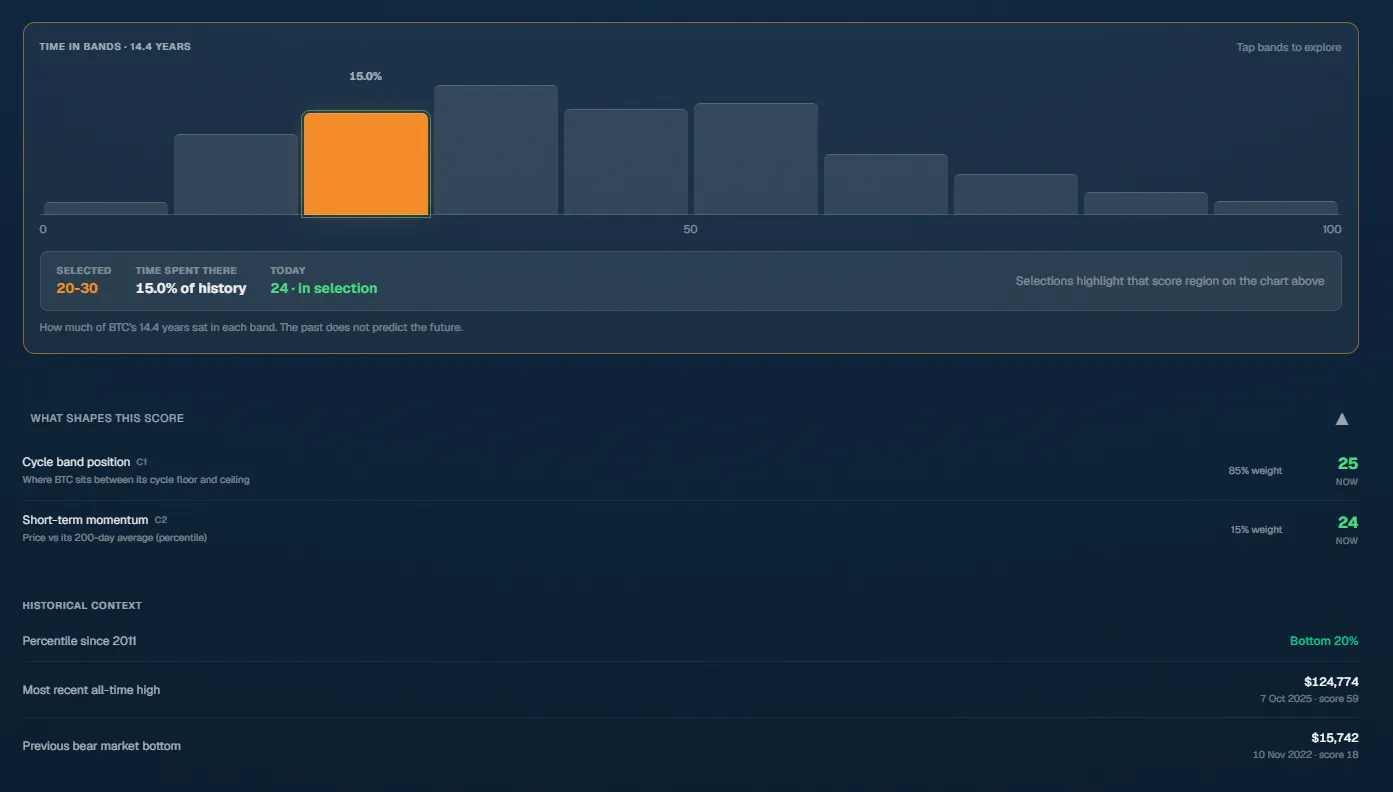
BTC $64,085, up 0.96% this week. The score sits at 24.3, up 1.6 points (7%) over the same timeframe, within the bottom 20% of all readings since 2011. We are in the 20 to 30 range, with BTC spending about 15% of its 14.4 year history in this area.
Retracement, because the system keeps receipts: on July 1 at $58,550, the lowest score printed of this cycle was 21.5. Since then, the price has risen about 9.5%, and the score has followed suit. None of this changes the plan. The next tier has its trigger, and the trigger has not moved.
BTC has recovered above the 200-week moving average this week, at about $62.9k, having lost it on July 1. So: that line is a life-or-death line for long-term holders, having battled below it for several months in the last two bear markets. A quick recovery is constructive. My plan does not trade moving averages, but this is the same transformation that the score’s momentum reading captured this week.
One Bitcoin now buys about 15.5 ounces of gold, the lowest point in nearly three years. Gold has significantly retraced, falling from a record high of nearly $5,100 in January to about $4,120, but BTC is still comparatively down: this ratio has roughly halved since the top in October when one coin could buy nearly 30 ounces. So: hard currency capital has been migrating to gold this cycle. When the crypto cycle turns around, this ratio will quickly revert. My plan does not trade this ratio, but there is no clearer picture to show how unloved BTC is right now.
Bitcoin's dominance is at 59%. So: the altcoin season is simply not on the radar. The bear market rule in the script: altcoins bleed longer and harder. The plan is to accumulate index leaders first and address the altcoin question much later in the cycle.
Jake's Workshop: Release Week
We had the biggest build week ever. Tom is a machine:
CSH Score v4.1 has gone live for BTC, with ETH, SOL, and XRP following closely behind. The website underwent a complete UI overhaul, including charts and mobile. And we ran a full security audit on something we’ve been pushing all year: the paid founders program.
To say the last thing straight: there will be a total of 100 founder seats, with permanently locked discounted pricing. That cap is real; it's not a marketing gimmick, so once it's full, it's full. If you want to be the first to see it, create a free account, and you will hear it from me before anyone else. For the price of one or two cups of coffee a month, you will get the score, a plan builder, and a dashboard to keep you honest on days you don't want to be.
Here’s an apology: if you were using a real-time plan for score triggers this week, the model change moved your reading, I know that’s frustrating. Short-term pain, long-term gain of much sharper tools. The full change log is on the website.
Outlook for Next Week
I’m watching three things, none of which require prediction:
The 200-week MA is around $62.9K. We reclaimed it this week after losing it on July 1. Holding above it is the first good sign; losing it again will put lower support levels back on the table.
The score's path to 20. In every previous bear market, it printed below that before the turn, but it hasn't yet this time. If it gets there, my plan will buy more aggressively. If it doesn’t, DCA has already given me a position. Keep an eye on this number with me in the app.
Gold rotation. If the BTC/gold ratio stops falling, that will be the earliest signal of hard currency capital looking our way.
We rebuilt our own model over 10 to 12 weeks before asking anyone to pay for it, and the new version makes today’s market look less like a bottom, not more so. This is the most inconvenient possible result for us business-wise, and yet we still released it. The system over hype has never been about making slogans.
This week, my question for you is this, and I will select the best answers for next time: what score level would compel you to deploy your last third of dry powder? Reply with a number. Mine is already written in my plan.
If you found this issue useful, give it a heart. Substack makes this decision to show it to others.
Talk next Sunday,
Thanks for reading. Share this with someone who might find it valuable.
免责声明:本文章仅代表作者个人观点,不代表本平台的立场和观点。本文章仅供信息分享,不构成对任何人的任何投资建议。用户与作者之间的任何争议,与本平台无关。如网页中刊载的文章或图片涉及侵权,请提供相关的权利证明和身份证明发送邮件到support@aicoin.com,本平台相关工作人员将会进行核查。


