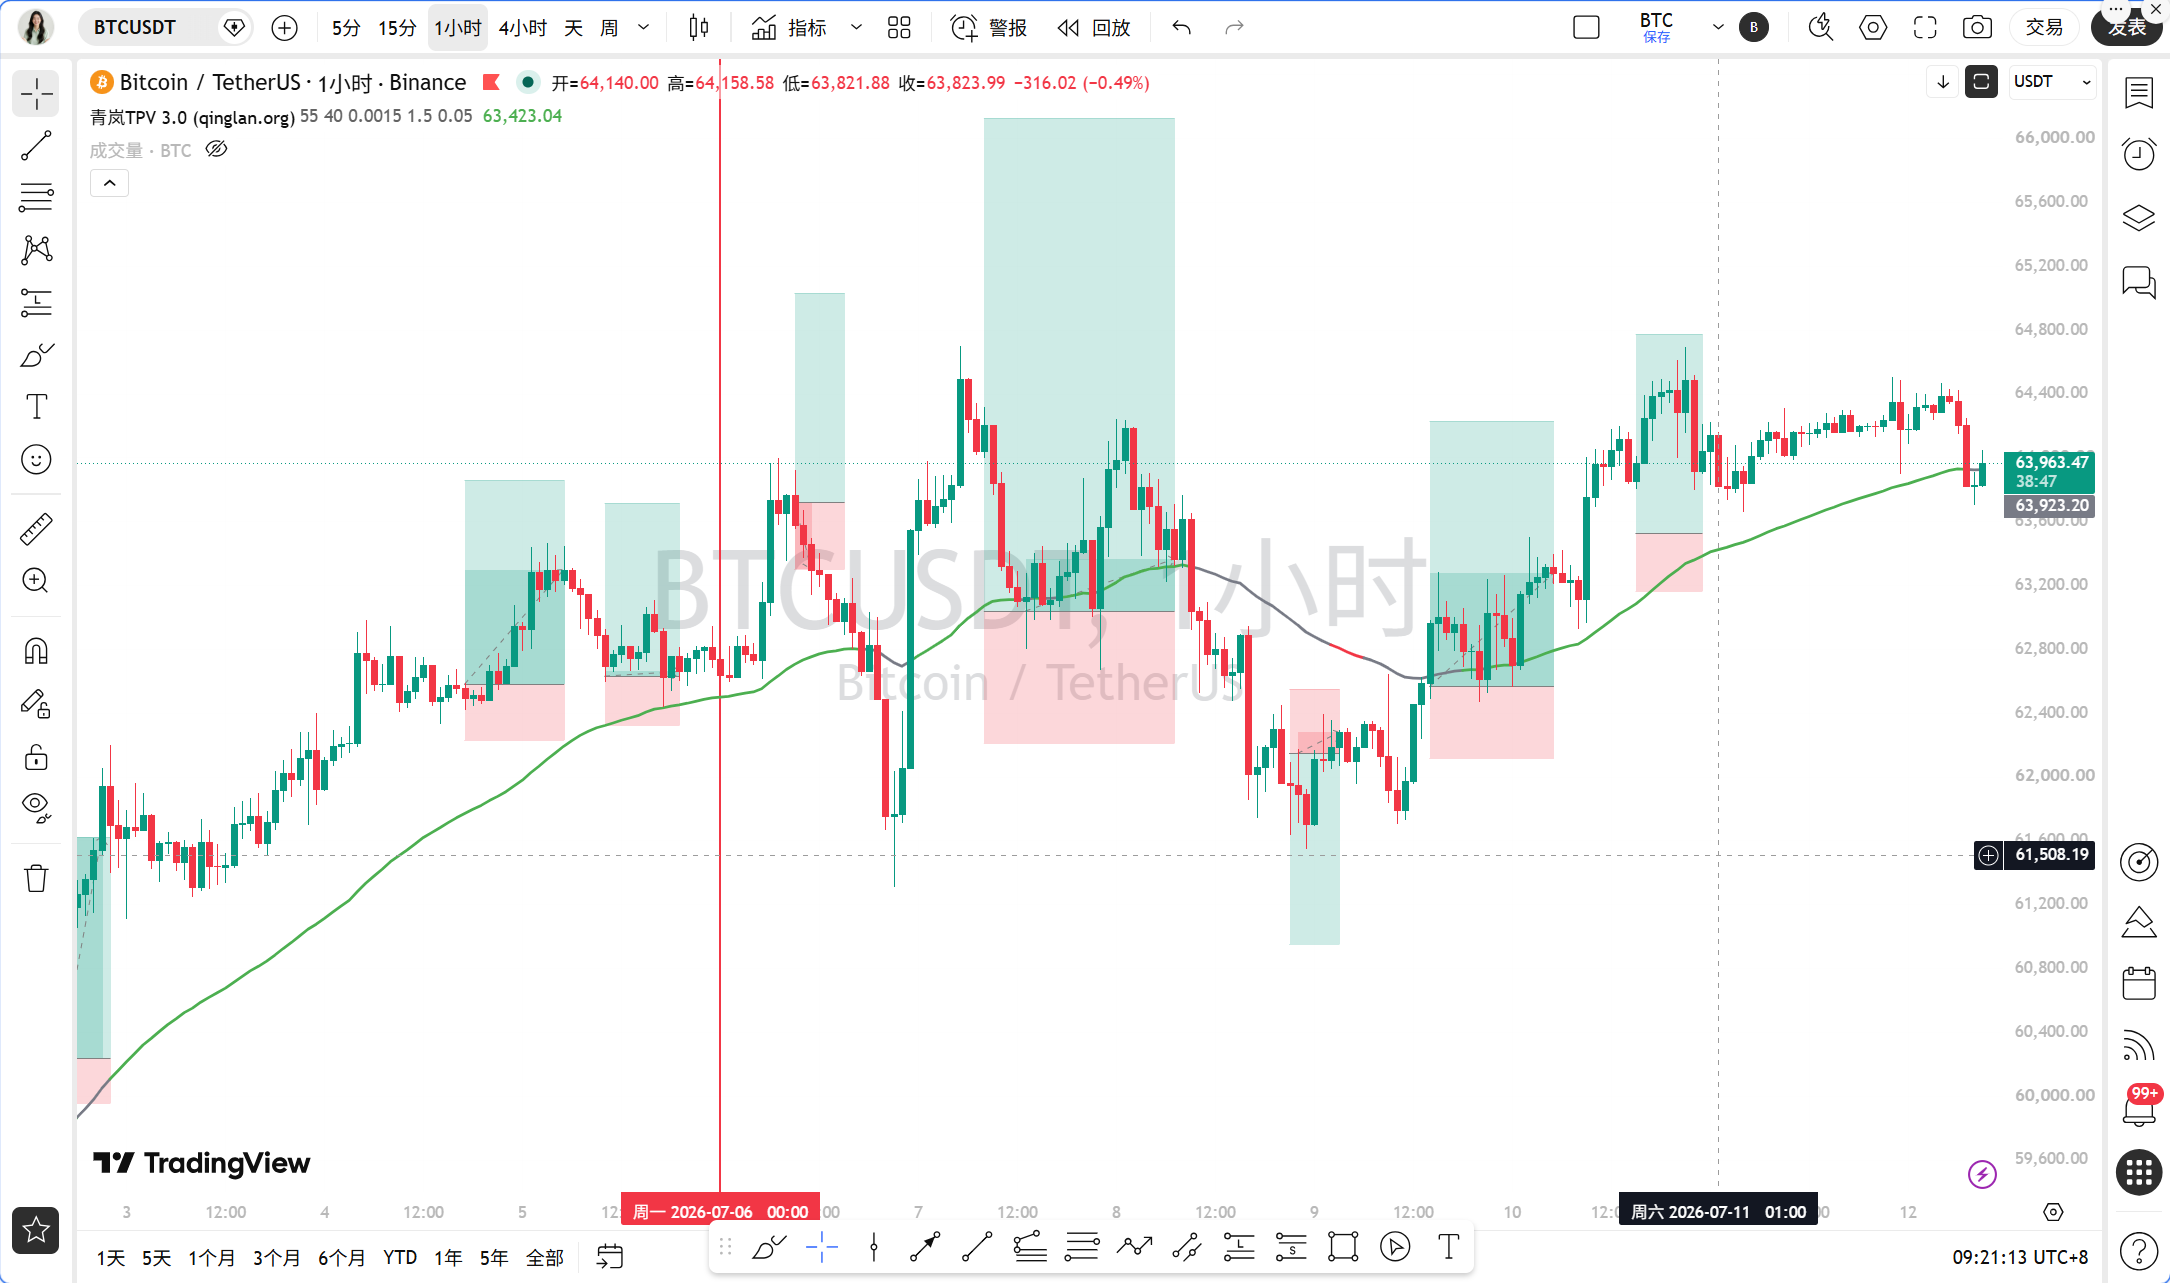
Good morning, everyone. I am Sister Qinglan. Before the market opens today, there are two key pieces of news worth focusing on. Firstly, the outflow of the Bitcoin and Ethereum spot ETFs in the United States has ended after 8 weeks, with a net inflow of $281.8 million last week. This directly reflects that institutional funds are flowing back in, and market confidence is recovering. The other news is that if Bitcoin breaks through $66,000, it will trigger the liquidation of over $567 million in short positions, which means that once the bulls exert power, the bears will face the risk of a squeeze. These two pieces of news combined provide strong support for bullish sentiment in the current market.
Current Price and Time
The current time is July 12, 09:23, and the Bitcoin price is 63,989 USDT. The 24-hour decline is 0.36%, with overall volatility remaining low, but the price has gradually rebounded from yesterday's low, indicating effective support below. The fear and greed index is at 26, in the fear zone, which often indicates that market sentiment is overly pessimistic, serving as a potential reversal signal.
Overview of Multi-time Period Status
First, let's look at the daily chart. The daily MA5 and MA10 are around 63,497 and 63,427, and the price has risen above these two moving averages. The MACD bar is 558.24, showing that bullish momentum is still accumulating. The RSI is at 68.58, close to the neutral strong area, but has not entered overbought territory, indicating there is still room for upward movement. In the daily structure, a double bottom has formed near $60,000, and the price is currently within a rebound channel.
4-Hour Level. The 4-hour MA5 and MA10 are around 64,093 and 64,089, respectively, with the price slightly below these two moving averages. The MACD has shown a death cross, with a bar value of -13.65, indicating weakened short-term momentum. The RSI is at 63.26, in the neutral strong area, but the death cross signal suggests that caution is needed regarding the risk of a pullback. However, the 4-hour MA30 at around 63,405 constitutes strong support.
1-Hour Level. The 1-hour MA5 and MA10 are around 64,039 and 64,168, with the price below these two moving averages. The MACD bar is -59.28, with both DIF and DEA being negative, indicating short-term bearish dominance. The RSI is at 42.28, in a weak area. However, the EMA55 is around 63,887, and the price is currently above this key moving average, serving as the bottom line for the bullish trend.
15-Minute Level. The 15-minute MA5 and MA10 are around 63,872 and 63,899 respectively, and the price has risen above these two moving averages. The MACD bar is -18.09, but both DIF and DEA remain negative, with an RSI of 29.50, close to the oversold area. This suggests that there is a demand for a rebound at the 15-minute level, but overall momentum is weak.
TPV Signal Verification
According to the Qinglan TPV system, we take the 1-hour EMA55 as the boundary between long and short positions. The current 1-hour EMA55 is 63,887.89, and the price of 63,989 is above this value, thus overall in the bullish trend area. However, the conditions for going long need verification.
Long Condition 1: The price stabilizes above the 1-hour EMA55. In the past 8 1-hour candlesticks, the closing price has been greater than EMA55 6 times and has crossed it 2 times. Although most candlesticks close above EMA55, the crossing frequency is relatively high, and the price's absolute distance from EMA55 is only 0.16%, indicating line-bound fluctuations. This does not meet the strict condition of two consecutive candlestick closes above EMA55 because the closing price of the most recent candlestick is slightly below EMA55. Therefore, Condition 1 is not fully satisfied.
Long Condition 2: Support Stabilization. A long lower shadow appeared near $63,800, and after hitting an effective low, the price rebounded, forming a bottom formation. This meets the support stabilization condition.
Long Condition 3: Weakening of Downward Momentum. The 1-hour MACD bars have shortened for 2 consecutive periods, from -70.12 to -59.28, with the RSI rising from 35 to 42.28, indicating the weakening of downward momentum. This meets the momentum exhaustion condition.
In conclusion, although Condition 1 is not fully satisfied, Conditions 2 and 3 have been established. Considering the price is experiencing line-bound fluctuations and the probability of consolidation is increasing, the current situation is in the consolidation phase of a bullish trend. The system indicates an increased probability of consolidation, thus refraining from actively going long or short, and only providing a range.
On-chain Capital Situation
In terms of on-chain data, the fear and greed index is at 26, in the fear zone, which typically indicates that market sentiment is overly pessimistic, serving as a potential reversal signal. The inflow of $281.8 million into U.S. ETFs indicates that institutional funds are entering the market. Bitcoin's market dominance is at 56.33%, still at a high level, showing that funds are concentrated in Bitcoin, while altcoins are relatively weak. The probability of the Federal Reserve raising interest rates in July has dropped to 34.2%, which is favorable for risk assets. Overall, the capital situation is leaning towards bullish.
Key Attack and Defense Levels
The first resistance level above is around $64,500, which is the suppression area of the 4-hour MA5 and MA10. If this is broken, the next resistance level is at $66,000, which is a dense area for short position liquidations. Once broken, it may trigger the liquidation of $567 million in short positions. The first support level below is around $63,800, which is the area of the 1-hour EMA55 and the 15-minute low points. If this is broken, the next support level is at $63,400, which is the support area of the 4-hour MA30 and daily MA5.
Trading Ideas
The current market is in a consolidation phase within a bullish trend, and the system indicates an increased probability of consolidation. Therefore, the trading idea focuses on range-bound fluctuations, avoiding buying high or selling low.
Direction: Range-bound fluctuation, selling high and buying low.
Entry Conditions: If the price pulls back to the $63,800-$63,850 area, and a bottom formation or long lower shadow appears in the 15-minute chart, a light long position can be taken. If the price rebounds to the $64,500-$64,600 area, and a top formation or long upper shadow appears in the 15-minute chart, a light short position can be taken.
Stop Loss Levels: Set the stop loss for long positions below $63,600 and for short positions above $64,700.
Target Levels: For long positions, target around $64,500; for short positions, target around $63,800.
Risk Warning
The current market is experiencing line-bound fluctuations, and the probability of consolidation is increasing. Set stop losses strictly to avoid chasing orders during breakout.
Follow Qinglan Crypto Classroom to seize more trading opportunities! Welcome to visit the official website www.qinglan.org
📊 Qinglan TPV Trading Strategy Backtest Reference
🕒 Last Backtest Time 07-12 07:00:02
Total Analysis: 2883 Backtests: 2241 Accuracy Rate: 75.7% (1696/2241)
免责声明:本文章仅代表作者个人观点,不代表本平台的立场和观点。本文章仅供信息分享,不构成对任何人的任何投资建议。用户与作者之间的任何争议,与本平台无关。如网页中刊载的文章或图片涉及侵权,请提供相关的权利证明和身份证明发送邮件到support@aicoin.com,本平台相关工作人员将会进行核查。