Today's market sentiment is complex, but there are two news items worth paying attention to. First, Bitwise pointed out that institutions are buying at lows, and each cycle bottom of Bitcoin is being raised, which provides long-term support for the current price. Secondly, New Hampshire has vetoed a $100 million Bitcoin bond project, which has temporarily impacted market sentiment, but the influence of such state-level policies is limited. Overall, the inflow of institutional funds and policy uncertainty are intertwined, as the market seeks direction amid fluctuations.
Current Price and Time
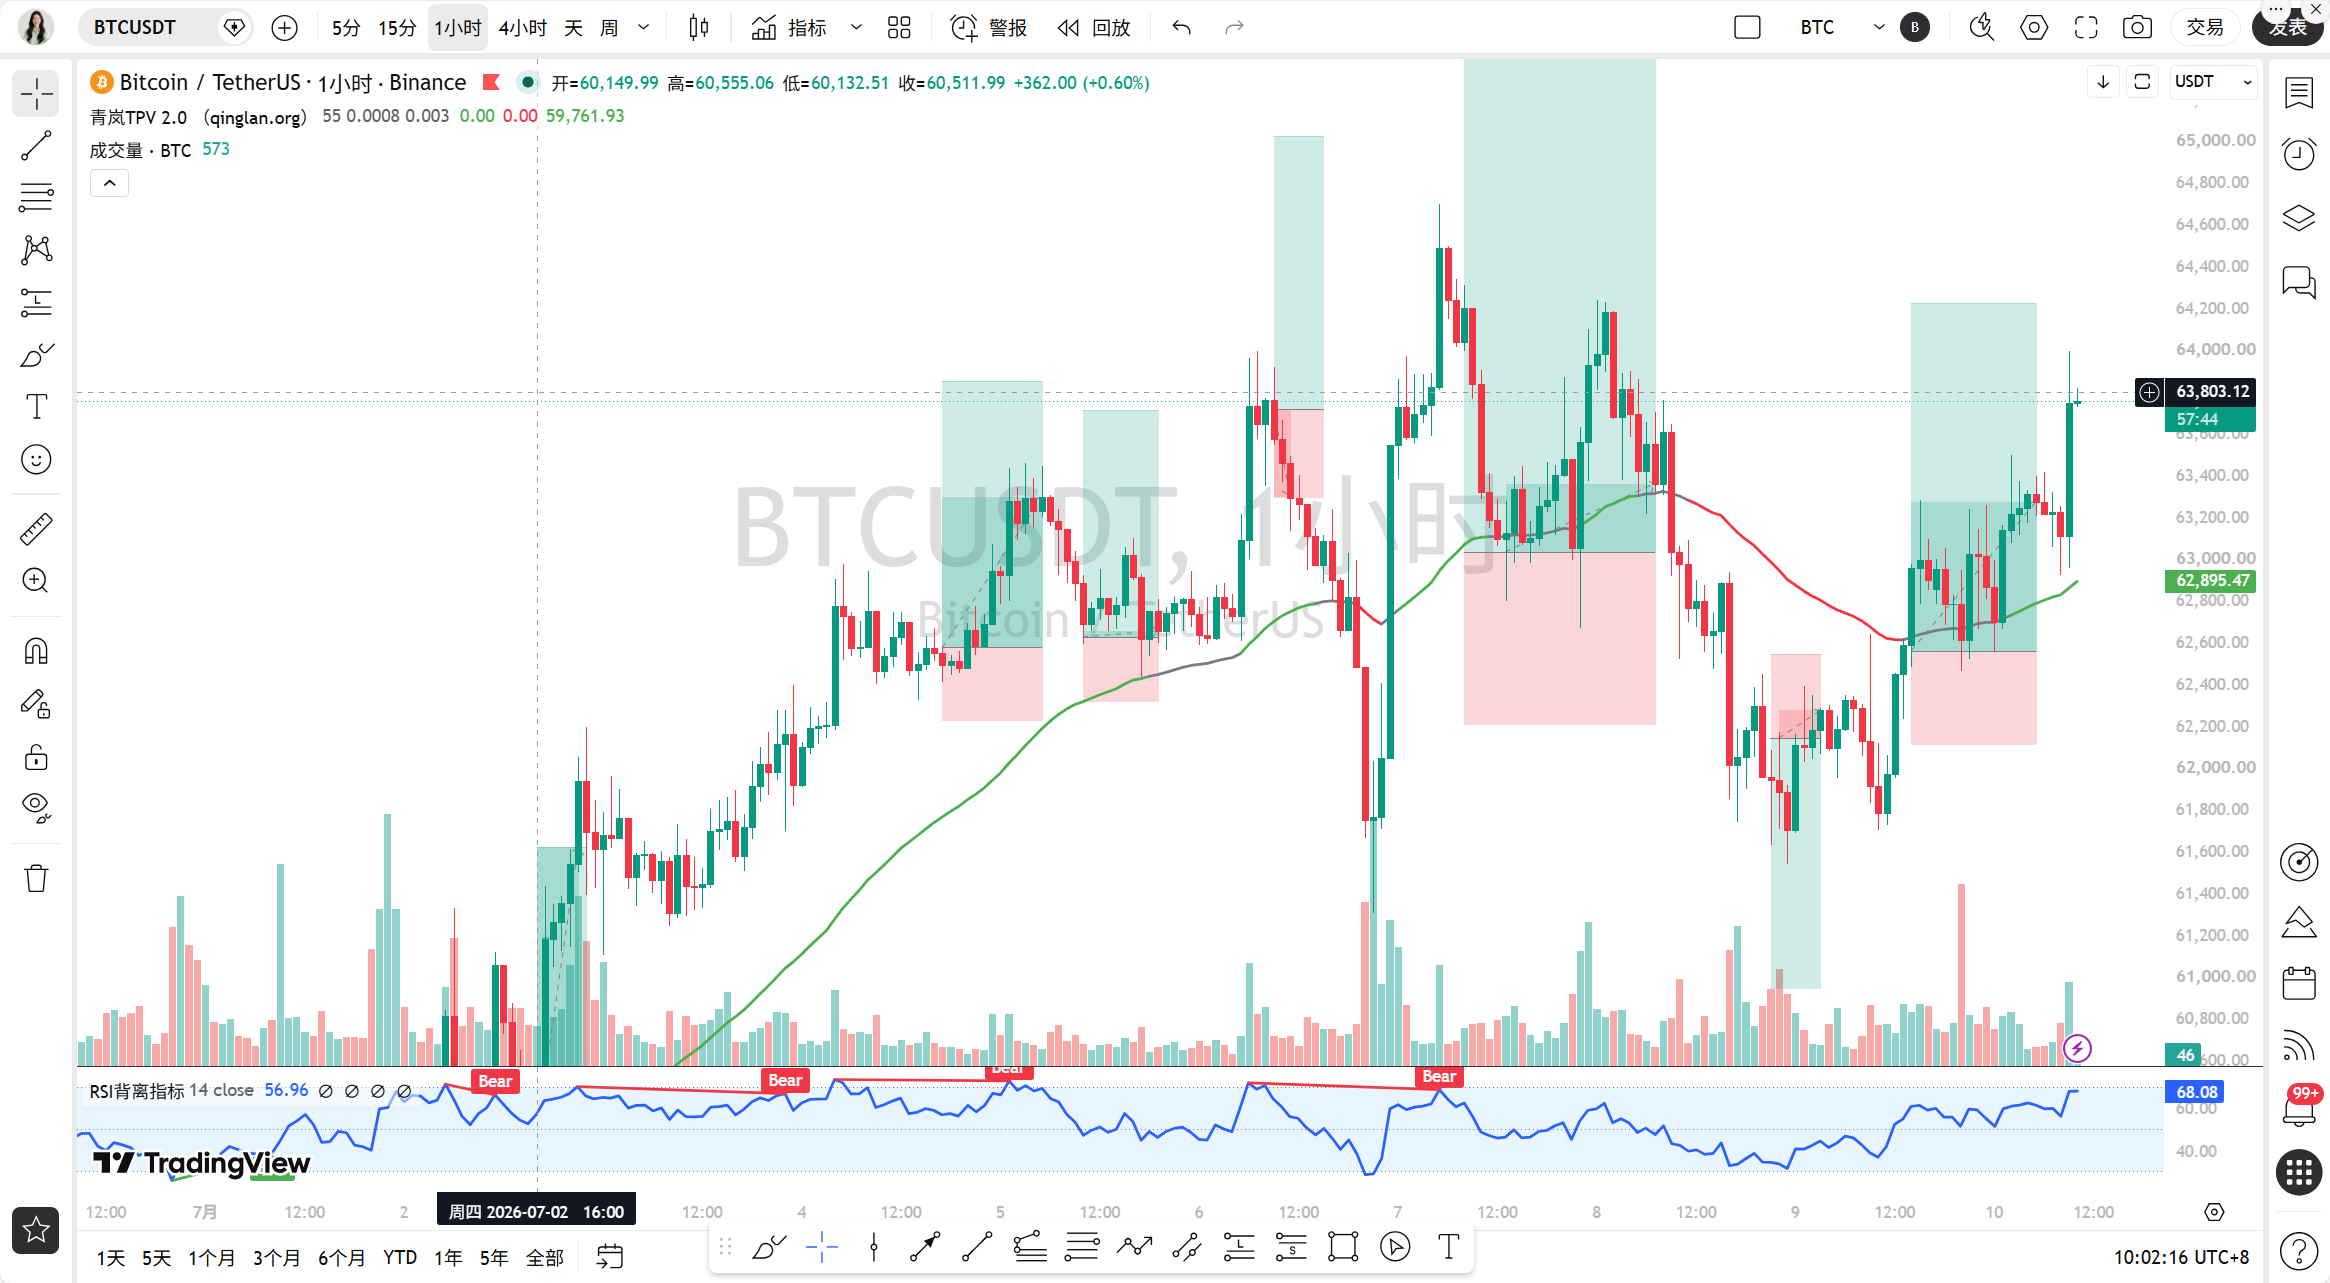
The current time is July 10th, 10:22 AM, with BTC priced at 63879 USDT. The 24-hour increase is 3.01%, and the fear and greed index is only 23, in an extreme fear range. This extreme sentiment often suggests potential rebound opportunities, but needs technical confirmation.
Multi-Cycle Status Overview
On the daily level, MA5 is at 63360, MA10 is at 62776, MA30 is at 62733, and the price is stable above the moving averages. The MACD histogram is at 600.18, DIF is at -473.77, and DEA is at -1073.94. Although DIF is still negative, the histogram continues to expand, indicating weakening bearish momentum. RSI is at 66.30, in a neutral to strong area. Overall, the daily outlook leans towards bullish recovery.
On the 4-hour level, MA5 is at 63202, MA10 is at 62725, MA30 is at 63034, and the price is above all moving averages. The MACD histogram is at 60.44, DIF is at 155.57, and DEA is at 95.13, with the dual lines operating above the zero axis and maintaining bullish momentum. RSI is at 50.54, in a neutral position, indicating sufficient short-term upward space.
On the 1-hour level, MA5 is at 63438, MA10 is at 63338, MA30 is at 62822, and the price is far above the moving averages. The MACD histogram is at 67.86, DIF is at 260.68, and DEA is at 192.82, with the dual lines diverging upwards and the bullish trend strong. RSI is at 76.99, close to the overbought area, but no divergence signals have appeared yet. EMA55 is at 62949, and the current price 63879 is approximately 1.48% above EMA55, representing a strong bullish area.
On the 15-minute level, MA5 is at 63657, MA10 is at 63390, MA30 is at 63310, and the price is operating above the moving averages. The MACD histogram is at 69.97, DIF is at 136.15, DEA is at 66.18, with the dual lines upward, but the histogram is slightly shortening, so caution is needed for a short-term pullback. RSI is at 77.24, in the overbought range, suggesting that the 15-minute level may face technical correction.
TPV Signal Verification
According to the Qinglan TPV system, the current 1-hour EMA55 is 62949, and the price 63879 is clearly above this line. In the past 8 1-hour candlesticks, the closing price has been greater than EMA55 8 times, with 0 crosses, and the amplitude is 1.48%, not meeting the fluctuation threshold, indicating that the market is in a one-sided bullish trend.
Long Position Conditions Verification:
Condition 1, the price stabilizes above 1H EMA55. The last 2 hourly candlesticks' closing prices are both above EMA55, and the current candlestick's closing price 63879 is far above 62949, thus the condition is met.
Condition 2, support stabilization. An effective low was formed near 62000 on the daily level, and the 4-hour MACD histogram continues to expand, indicating enhanced bullish momentum. Although there is overbought on the 15-minute level, no significant pullback has occurred, confirming solid support.
Condition 3, downward momentum exhaustion. The daily MACD histogram continues to expand, and RSI has rebounded from below 30 to 66, clearly showing exhaustion of bearish momentum. Although the 1-hour MACD histogram has shortened in the short term, the overall trend is upward, and the conditions are basically met.
In summary, the TPV system confirms the bullish trend, but the 15-minute RSI overbought signals suggest short-term pullback risks, and stronger entry points should be awaited.
On-chain/Fundamentals
On-chain data shows a fear and greed index of 23, indicating extreme fear, which is a typical bottom signal. Historical data indicates that after extreme fear, the market often rebounds. The news of institutions buying at lows aligns with on-chain data; long-term holders have incurred losses at a 3.5-year high, but this also suggests that selling pressure may be nearing its end. WTI crude oil fell sharply by 4%, alleviating inflationary pressures, which is favorable for risk assets. U.S. stocks related to cryptocurrency surged, with MARA Holdings soaring by 15%, reflecting positive fund sentiment.
Key Defense and Attack Positions
Upper resistance level: 64500, which is the previous high, and also near the upper Bollinger Band on the 4-hour chart. After breaking through, the next focus is on the 65000 round number.
Lower support level: 63400, which is the intersection area of 1-hour MA5 and MA10. If it breaks below, the next support is at 62950, which is the 1-hour EMA55 position, a lifeline for bulls.
Trading Idea
Direction: Primarily bullish, but wait for a pullback to enter.
Entry Conditions: Price retraces to the 63400-63500 range, and there appears a bottom formation or long lower shadow on the 15-minute chart, while the MACD histogram shortens and then expands again. If the price directly breaks through 64500 and stabilizes, a long position can be pursued.
Stop Loss Level: Below 62950, that is, under 1-hour EMA55, with a stop loss of about 1.5%.
Target Levels: First target 64500, second target 65000, third target 66000.
Risk Warning
15-minute RSI overbought may trigger a short-term pullback; if the price breaks below 63400, caution is needed for a bullish trap; strict stop loss is recommended.
Follow Qinglan Crypto Classroom to seize more trading opportunities! Welcome to visit the official website www.qinglan.org
📊 Qinglan TPV Trading Strategy Backtest Reference
🕒 Last Backtest Time 07-10 07:00:02
Total Analysis: 2837 Backtests: 2202 Accuracy Rate: 75.2% (1657/2202)
免责声明:本文章仅代表作者个人观点,不代表本平台的立场和观点。本文章仅供信息分享,不构成对任何人的任何投资建议。用户与作者之间的任何争议,与本平台无关。如网页中刊载的文章或图片涉及侵权,请提供相关的权利证明和身份证明发送邮件到support@aicoin.com,本平台相关工作人员将会进行核查。