Currency Circle Liying: 7.10 Bitcoin (BTC) and Ethereum (ETH) Latest Market Analysis
Bitcoin is currently priced at 62900, and the current candlestick pattern is a typical squeezed market with pressure above and support below. The current strategy is to wait for a rabbit to appear before releasing the eagle; either wait for it to break up and stabilize before chasing, or wait for it to drop down and stabilize before buying. During this fluctuation period, observe more and act less, the moving average price is currently running near the short-term moving average, but constrained by the long-term moving average above, indicating an unclear trend, on the brink of a change. The MACD adjustment has not completely ended, and the bullish strength has not fully gathered yet. The price is currently running between the middle track and the upper track; if the price cannot effectively stay above the middle track and break through the upper track with volume, then the probability of retracing to the lower track for support will increase. Overall, the indicators show that the market is building momentum, waiting for a clear breakthrough.
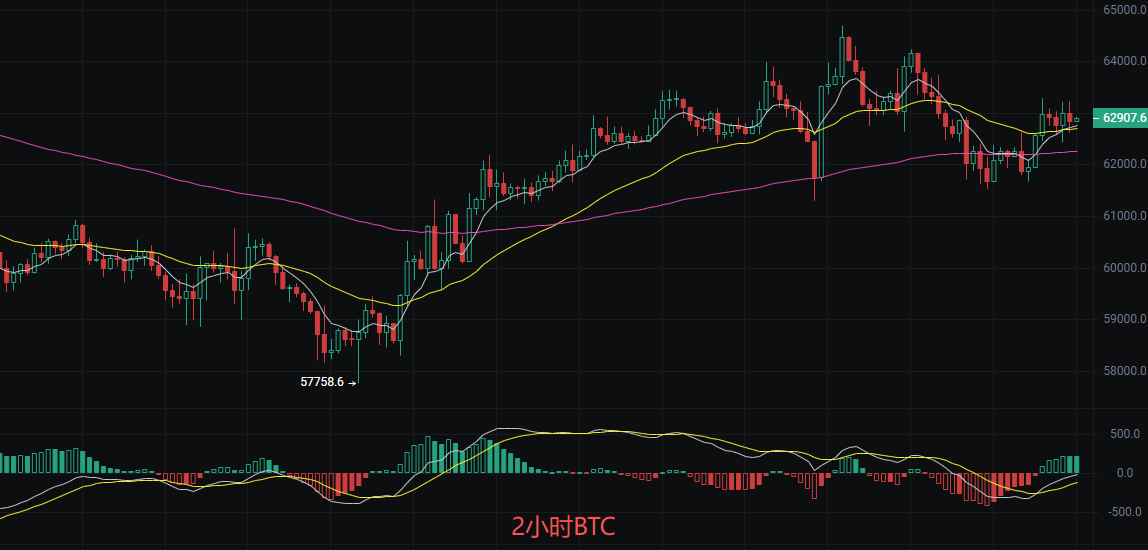
Short-term Trading Ideas:
Buy on the dips at 62200-61700, stop loss at 61200, target 63000 aiming for 64000
Sell on the rallies at 63500-64000, stop loss at 64500, target 62500 aiming for 62000
Ethereum
Folks, Ethereum was at 1740 before the article came out. In general, the previous upward trend has not completely broken down yet; it now appears to be in a high-level consolidation pattern. As long as it does not fall below key support, the bulls still have a chance to fight back. From a technical perspective, the moving average system is currently suppressed below the 1743-1750 range, indicating that short-term bearish strength dominates. The medium-term trend is still bullish. In the MACD indicator, the fast and slow lines have diverged downwards after a death cross above the zero axis, and although the red momentum bars have not surged significantly, they still exist, meaning that the adjustment has not ended. The price has touched the middle track and is attempting to test the lower track; the opening shows signs of narrowing, which usually indicates that a change is imminent and volatility is being compressed; we need to be vigilant for subsequent directional choices.
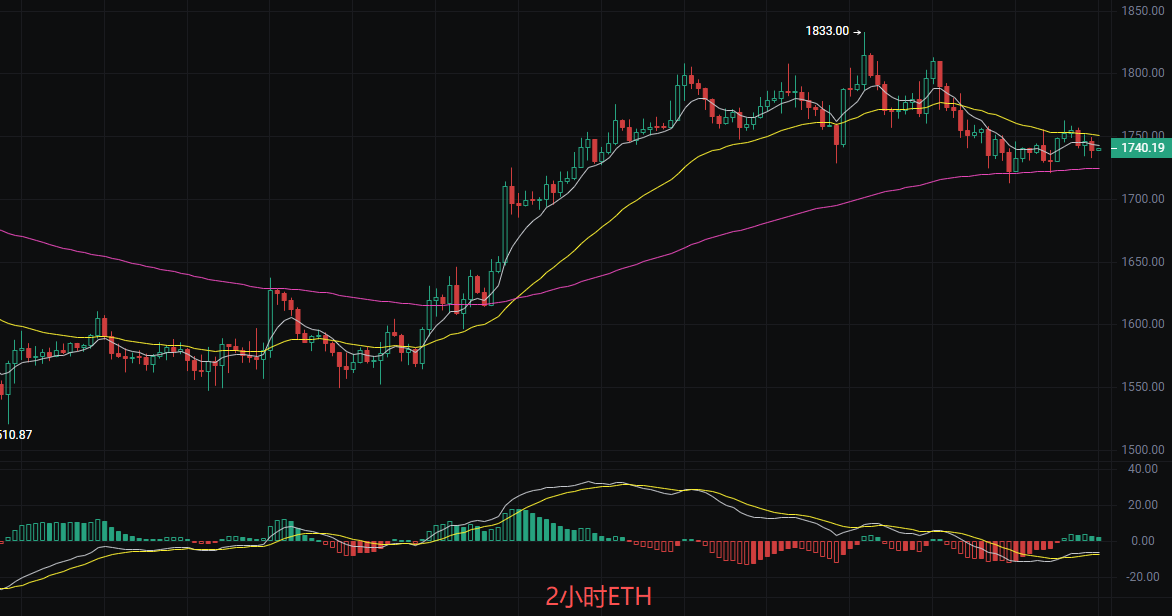
Short-term Price Points Reference:
Buy on the dips at 1720, defense at 1680, stop loss at 1650, target 1800 aiming for 1850
Sell on the rallies at 1840, defense at 1860, stop loss at 1900, target 1780 aiming for 1730
The above content is exclusively created by Liying, please indicate the source when reprinting! The publication review has a certain delay, and the market changes rapidly; the above suggestions are for reference only and risks are self-borne.

Friendly reminder: The above content is solely created by the author on Weibo. The advertisements at the end of the article and in the comments section are unrelated to the author. Please be cautious in distinguishing them. Thank you for reading.
免责声明:本文章仅代表作者个人观点,不代表本平台的立场和观点。本文章仅供信息分享,不构成对任何人的任何投资建议。用户与作者之间的任何争议,与本平台无关。如网页中刊载的文章或图片涉及侵权,请提供相关的权利证明和身份证明发送邮件到support@aicoin.com,本平台相关工作人员将会进行核查。