Original | Odaily Planet Daily (@OdailyChina)
Author | Wenser (@wenser 2010)
According to Coinglass data, from May 19 to today (July 3), the Coinbase Bitcoin premium index has been in a "negative" state for 46 consecutive days, setting the record for the "longest consecutive negative" period. Previously, this index was in a negative premium for 40 consecutive days from January 16 to February 24 this year, marking the longest "consecutive negative" record since the index was launched, exceeding the approximately 30 days of consecutive negative premium during last year's "10·11 crash".
Considering that BTC and ETH recently fell below key points such as $58,000 and $1,600, the exact timing for the end of the bear market remains unclear, making the wait particularly torturous for many.
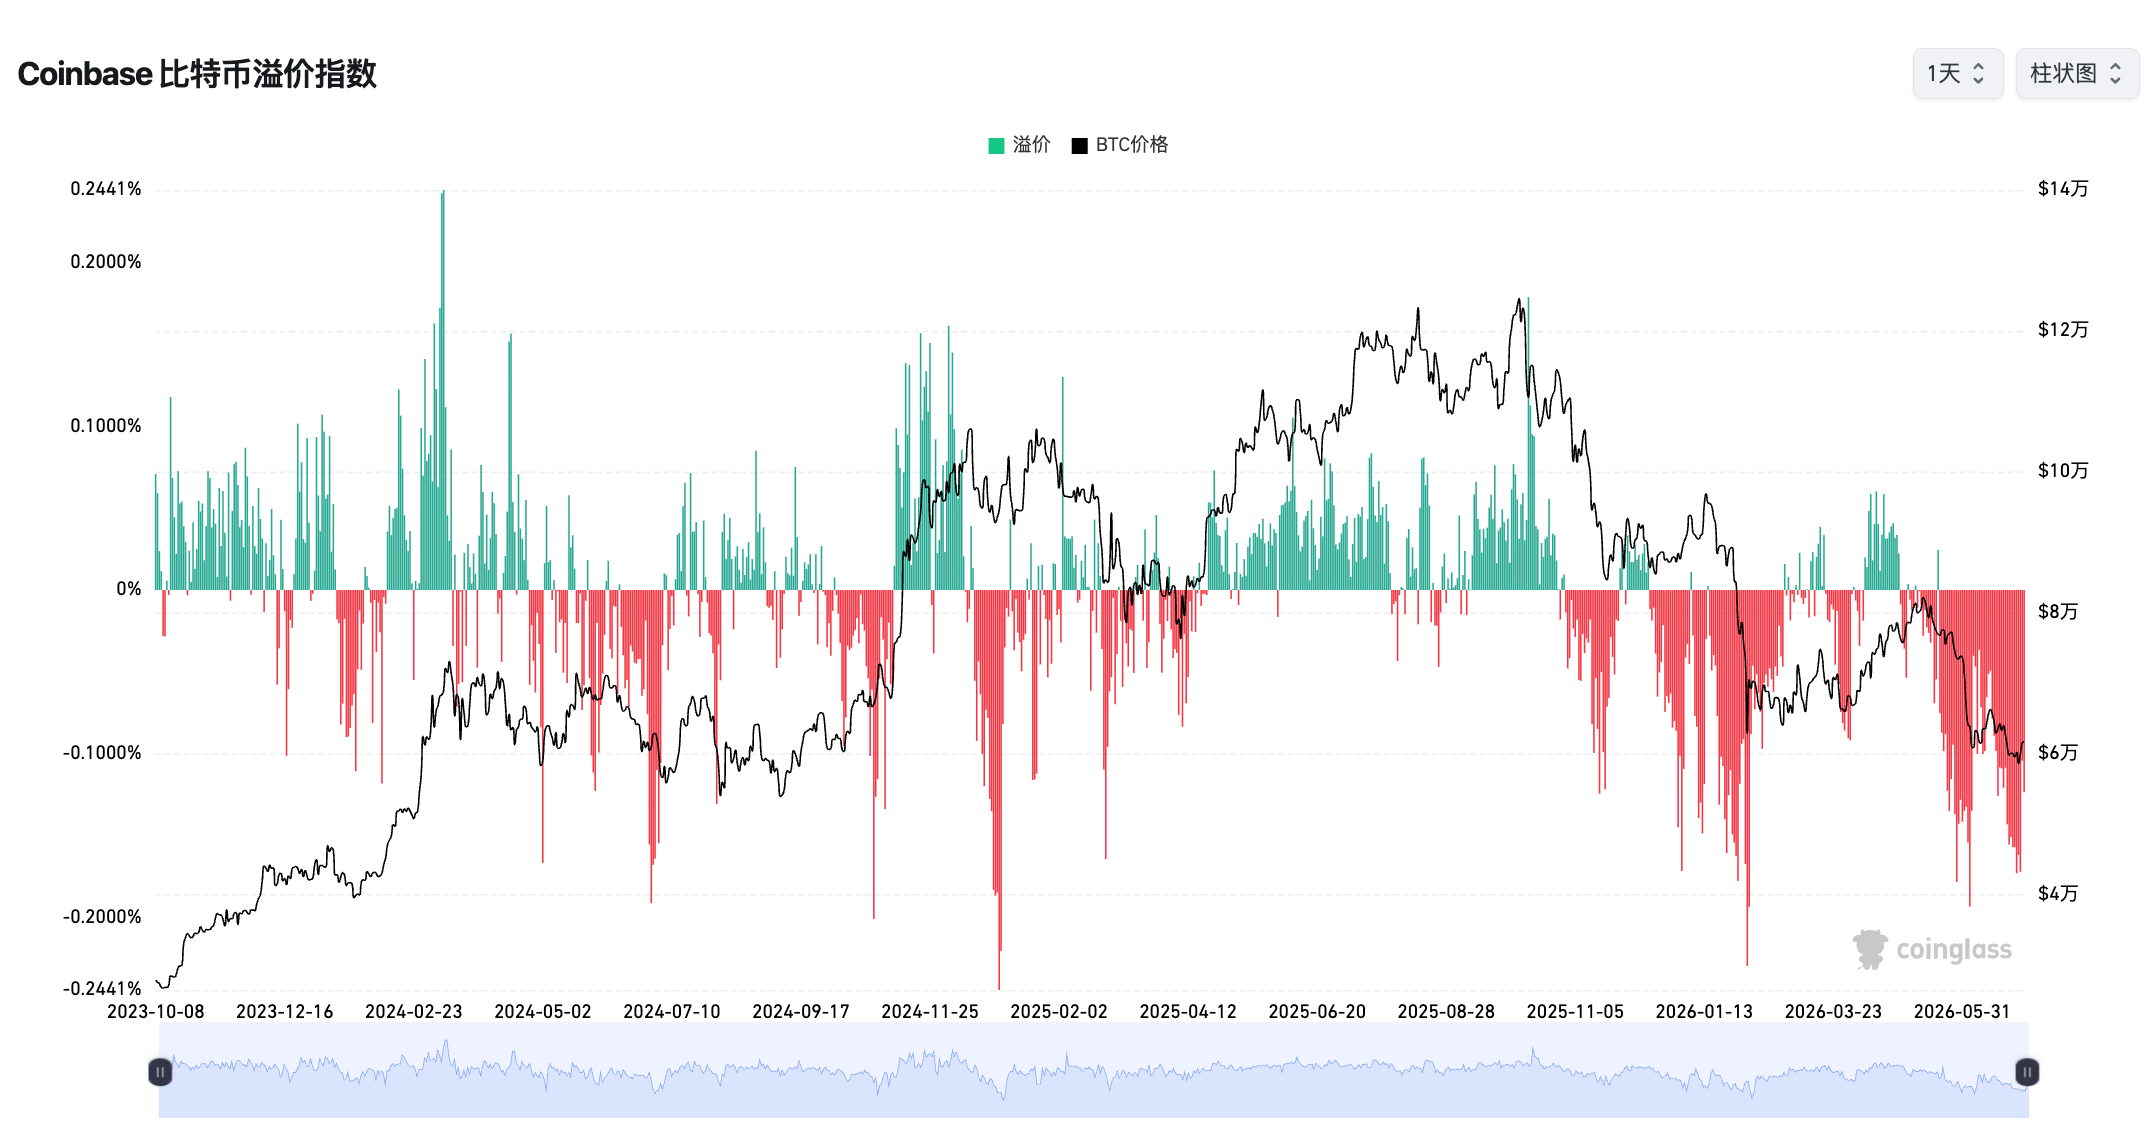
Overview of the Coinbase Bitcoin premium index
The Biggest Trigger for BTC's Plunge: Strategy Sells Coins to Survive, Expanding Losses Among Investors
At the end of May and beginning of June, the largest BTC treasury company and leading cryptocurrency stock Strategy sold BTC again for the first time in three years. This transaction, involving only 32 BTC, quickly triggered panic in the cryptocurrency market, like the last straw that broke the camel's back. Prices of mainstream coins like BTC, ETH, and SOL plunged accordingly.
Combined with factors such as continuous net outflows from Bitcoin spot ETFs and ongoing bleeding in the cryptocurrency market, the shadow of crypto bear markets once again looms over everyone's mind in the industry.
The Beginning of the Bear Market: BTC Once Recorded Its Worst Weekly Performance Since 2022 in Early June
In the first week of June, Bitcoin briefly fell below $60,000, recording its worst weekly performance since the collapse of FTX in 2022. In the near 7 days up to June 7, Bitcoin cumulatively dropped by 16%, retreating over 50% from its historical high of over $126,000 in 2025.
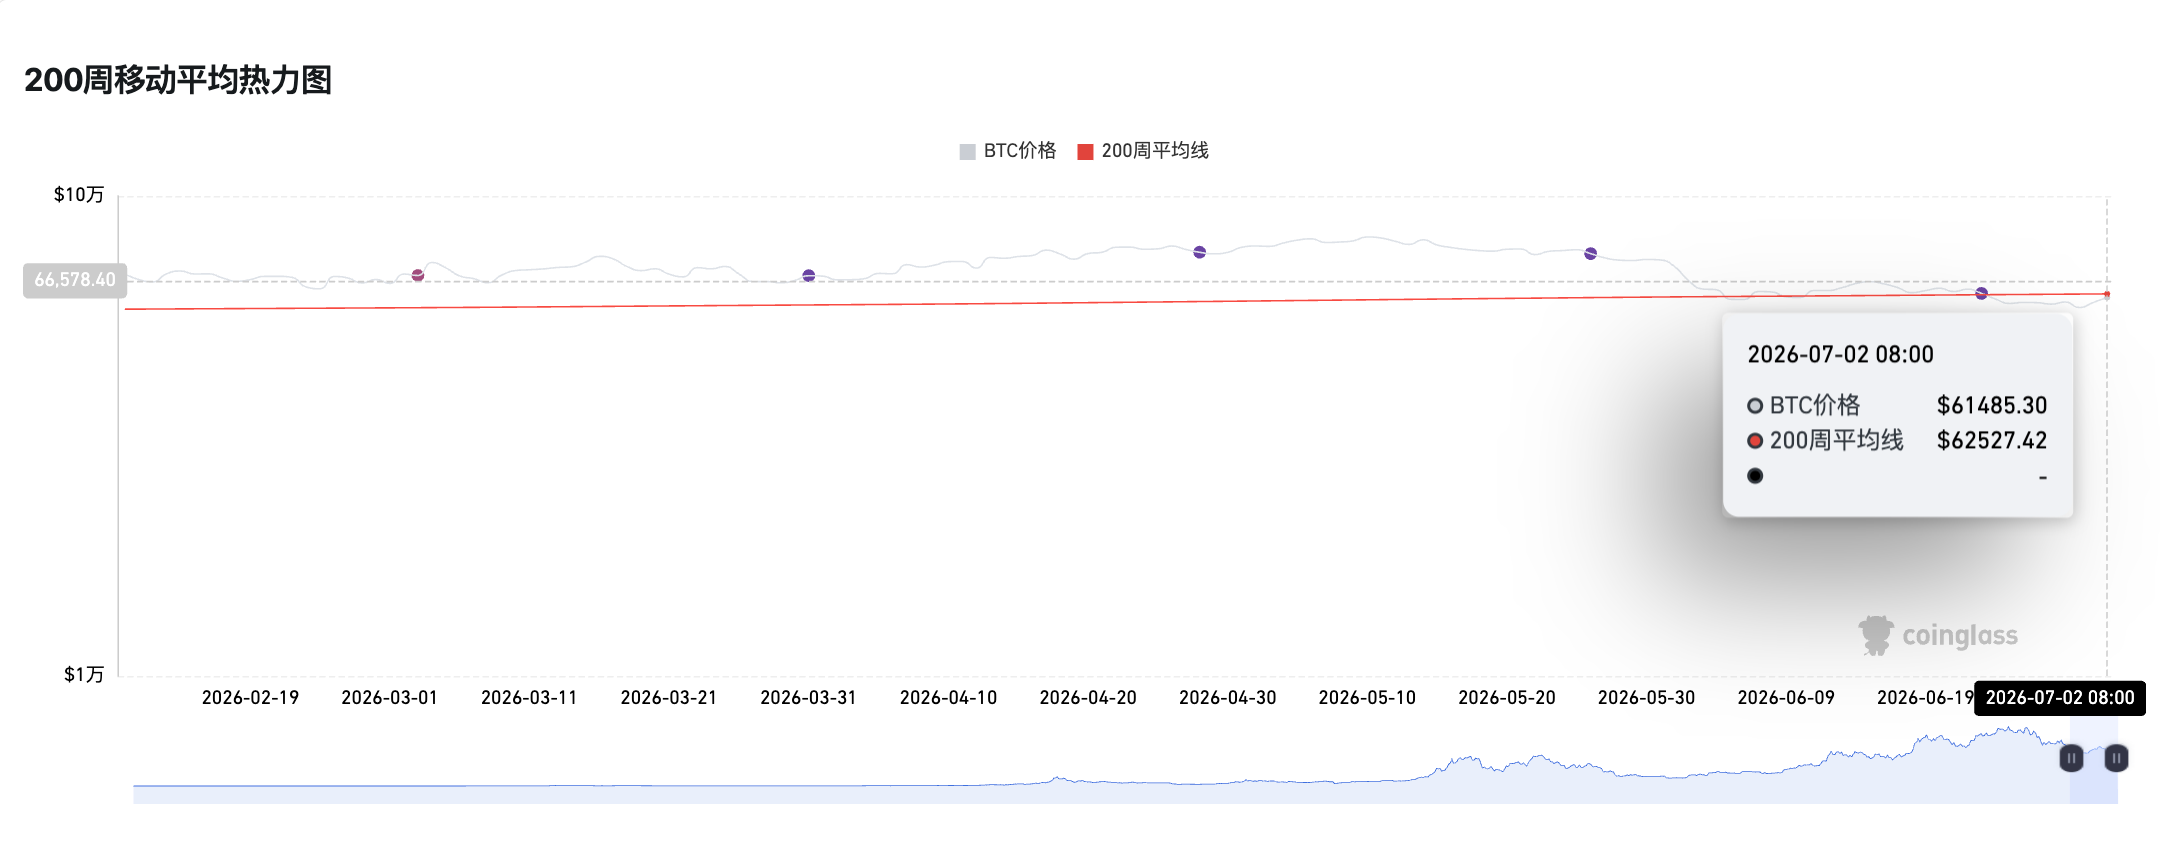
At that time, US spot Bitcoin ETFs had recorded net outflows for 13 consecutive trading days, with a cumulative outflow of approximately $5.5 billion. At the same time, Bitcoin price fell below the "200-week moving average," widely regarded as a critical support level, further weakening market confidence.
Senior executive Paul Howard of crypto trading firm Wincent described the current market as a "silent bear market," believing that falling below the 200-week moving average is a significant confirmation signal for the market entering a bear phase.
Although BTC later slightly rebounded to around $65,000, several market analysts warned at the time that the rebound might be hard to sustain, indicating that Bitcoin may not have reached the bottom of this cycle yet. Griffin Ardern, co-founder of Primal Fund, stated that the market is still quite a distance from the "real bottom."
In my opinion, if the market had high hopes for a significant rebound for BTC in May, Strategy's action to sell coins for survival directly shattered the last shred of illusion, marking the symbolic opening of the "bear market confirmation" curtain.
The Bear Market Continues: Many Institutions' Predictions of the Bear Market's End Are Proven Wrong
On June 11, crypto research institute CryptoQuant stated that Bitcoin might form a bottom around $53,600, a level representing the current realized price of Bitcoin, or the on-chain average cost basis for all market participants. The report pointed out that in previous major bear market cycles, Bitcoin typically bottoms out near or slightly below the realized price level.
On June 12, BIT released its latest weekly report "Will the FIFA World Cup Mark the End of the Bitcoin Bear Market?" It stated that the current bear market trajectory of Bitcoin is largely consistent with its outlook from early February 2026, where the previously predicted A-B-C adjustment structure has entered its final stage: after wave A falls to the $60,000-$69,000 range, Bitcoin rebounds to the $80,000-$90,000 range and peaks around $83,000, following which the rebound momentum gradually weakens.
BIT pointed out that the current fear and greed index is nearing historically significant low regions, with some similarities to the structural bottom of the 2022 bear market. It maintains the previous view that the summer trading lull during the 2026 World Cup may become the final stage of this bear market.
On June 17, crypto research company K33 reported, noting that the supply of Bitcoin held by long-term holders has reached a historical high, indicating that the bear market may be nearing its end. It emphasized that the activity of reactivating old coins from 2026 is notably low; as of June 6, only 218,421 Bitcoins have been reactivated, showing that on-chain selling pressure has significantly weakened; in comparison, 1.18 million Bitcoins were reactivated during the same period in 2024. K33 believes that the drop in old coin activity indicates a reduced willingness to sell among long-term holders, and patient participants continue to absorb the supply.
However, BTC's further decline soon shattered the illusions surrounding these views, and the bear market continued.
Bear Market Indicators: STRC Depegged from $100, BTC and ETH Long-term Holders' Losses Expand
On June 18, after falling below $95 at the beginning of the month, Strategy's preferred stock STRC fell below $90, closing at $89, marking the lowest daily closing price since the IPO, and also the lowest closing price after dividend adjustment since last November.
Subsequently, STRC continued to drop, losing its peg.
On June 26, STRC pre-market price briefly dipped to $73, setting a new historical low. The market's focus then shifted to two matters: first, the dividend announcement on June 30, with eligible holders receiving $0.48 per share on July 15; secondly, the monthly dividend rate reset, at which time STRC's effective yield approached 15%, and investors anticipated that Strategy would raise the dividend rate from 11.50% to at least 12% or 12.50%.
Three days later, on June 29, Strategy officially announced a $1 billion digital credit securities repurchase plan; and launched a board-approved "up to $1.25 billion BTC monetization plan." Its dollar reserves also increased to $2.55 billion as various fundraising plans were implemented, enabling the payment of dividends for preferred stocks like STRC. The price of STRC temporarily stabilized, rising above $80, currently reported at $87.87.
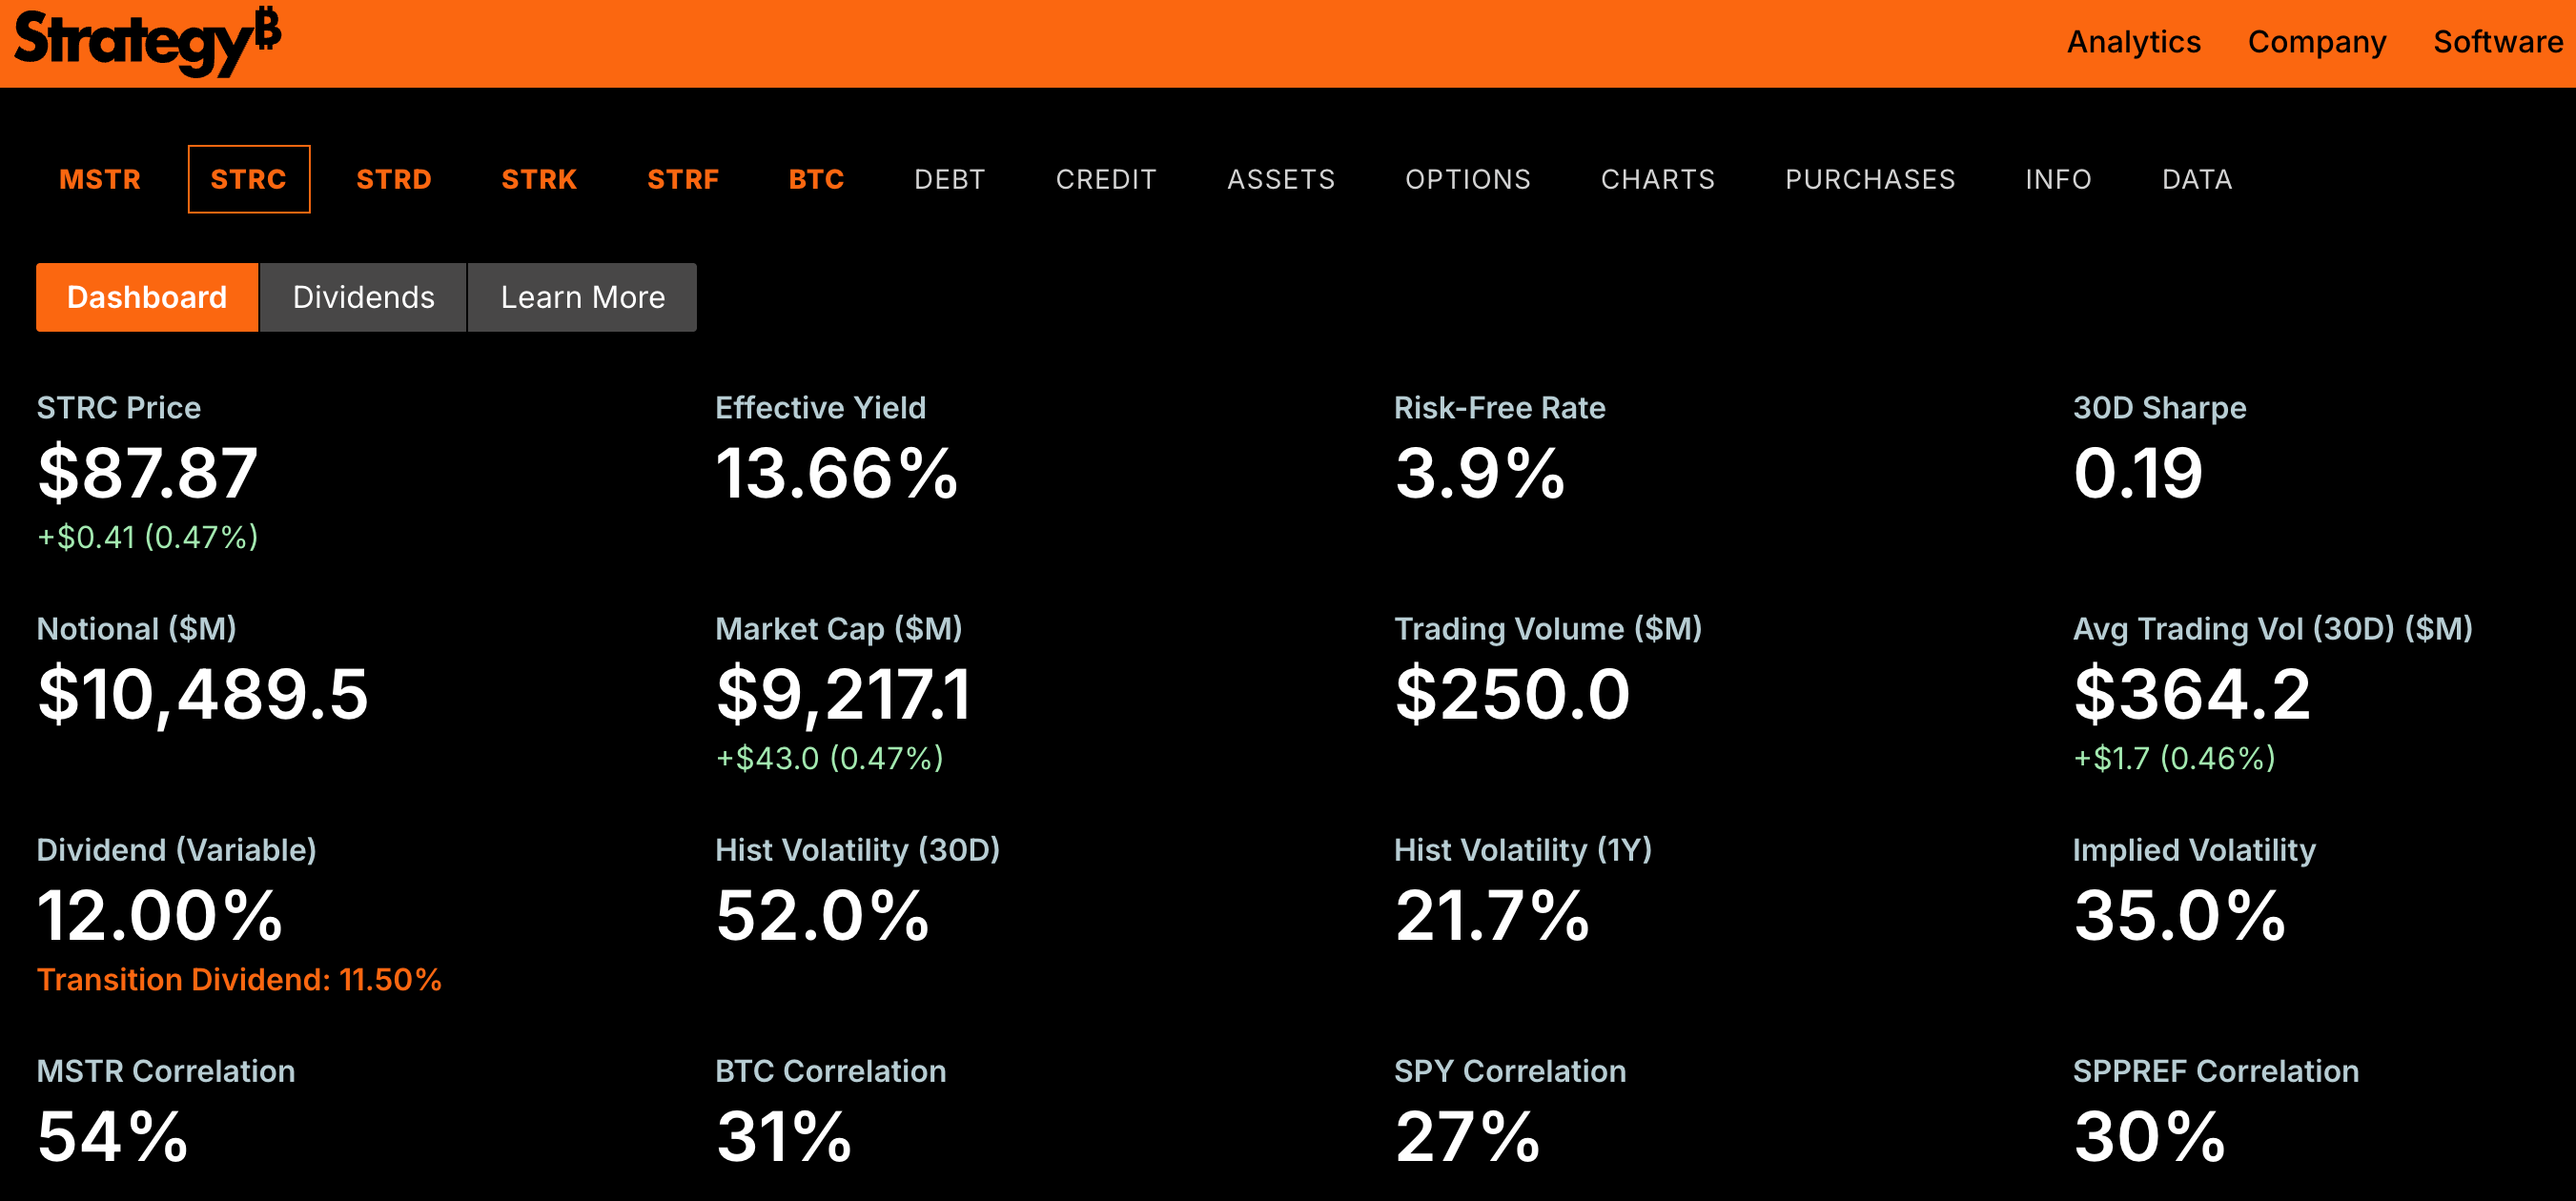
Image source: Strategy official website
However, due to the continued decline of BTC and ETH, long-term holders' losses have further expanded.
On June 25, Bitcoin briefly fell to around $59,100, with 10.83 million BTC in a state of loss, reaching a historical high scale, surpassing the previous bear market bottom of about 10.5 million; long-term holders (those holding for at least 155 days) held a record 14.8 million BTC (Odaily Planet Daily note: the total circulating supply of Bitcoin is approximately 20 million), of which 37% were in a state of loss. The latest data shows that the number of long-held BTC has increased to 16.61 million today, with an average holding cost dropping to around $49,700.
On June 26 data, ETH whales are in a state of loss, marking the first occurrence of this scenario since 2019; even during the 2022 bear market, the largest whale holding over 100,000 ETH maintained profitability. The current unrealized profit ratios for the three categories of whale groups are all negative, with the range of 1,000 to 10,000 ETH at -0.26, 10,000 to 100,000 ETH at -0.21, and over 100,000 ETH at -0.05. This state has persisted for several weeks.
On June 28, Bitcoin UTXO data showed that the current market's proportion of loss-making trades to profitable trades has dropped to the lowest level in this bear market cycle, indicating that investors are entering a clear "surrender" phase. The last occurrence of a similar low point was during the deep stage of the mid-2023 bear market when Bitcoin prices had once fallen to about $26,000.
Previously, due to the sustained price drop, ETH's market value once fell below $185 billion, being surpassed by USDT. As prices rebounded to above $1,700, the current market cap of ETH is temporarily reported at $207 billion.
In summary, STRC re-pegging at $100 and the exit from loss status by BTC and ETH long-term holders will be key indicators for the end of the bear market.
Speculation on the End Date of the Bear Market: August or December?
Regarding the specific timing of the bear market's end, there is currently no mainstream opinion in the market; we will provide insights based on some industry perspectives.
Li Hua: July-August May Be a Good Time to Buy the Dip
At the end of June, TrendResearch founder Li Hua stated that the current drop is the third wave since 1011, and according to volatility theory and cycle规律, this is the last major drop for Bitcoin.
The market is most concerned about the bottom price for Bitcoin, with key factors being the US stock market and MicroStrategy; the Federal Reserve's concerns regarding CPI may trigger changes in expectations for interest rate cuts or increases, leading to continuous adjustments in the US stock market. Furthermore, past bear market tails have often seen black swan or explosion events, which have not yet occurred this cycle, requiring close observation.
Based on Bitcoin's historical high of $126,000, a 60% drop corresponds to $51,000, and a 66% drop corresponds to $43,000. In any case, July to August should be the final time and the best opportunity to buy the dip, even the most worthwhile trading opportunity in the next three years.
Jiang Zhuoer: BTC Will Bottom at $42,000-$44,000 in October to December
On June 25, LiteGroup mining pool founder Jiang Zhuoer predicted that the current BTC bear market will bottom at $44,016 on October 31 this year. Based on the pattern that mNAV leads coin prices to bottom in 6 months, the bottom time window has been adjusted to October to December 2026, with the bottom price range being $42,000 to $44,000.
He pointed out that the underlying logic is that the mNAV of Strategy's common stock MSTR has fallen to 0.72, close to the previous bull market's low point of 0.7 on May 11, 2022. Based on recent events like STRC's significant depegging, the current market sentiment can be predicted to be in the lowest range for this cycle of mNAV. However, the lowest mNAV does not necessarily mean BTC price is at its lowest; the last mNAV bottom was seen at 0.7 on May 11, 2022, when the BTC price was $31,017, whereas Bitcoin bottomed at $15,476 on November 21, 2022, with an mNAV of 1.2, a 6-month gap between the two.
BTC Price Indicators: 4-Year Average Price and 200-Week Moving Average Heatmap
According to Coinglass data, the 4-year average price index for BTC showed that from June 25 to June 30, due to BTC dropping below $59,000 at one point, this index fell to 0.95; it has since recovered to around 1 as BTC rebounded to above $61,000.
According to the 200-week moving average heatmap, BTC price is currently roughly equal to the 200-week average line, and has remained below the 200-week average line since June 23, which may suggest the price has bottomed.
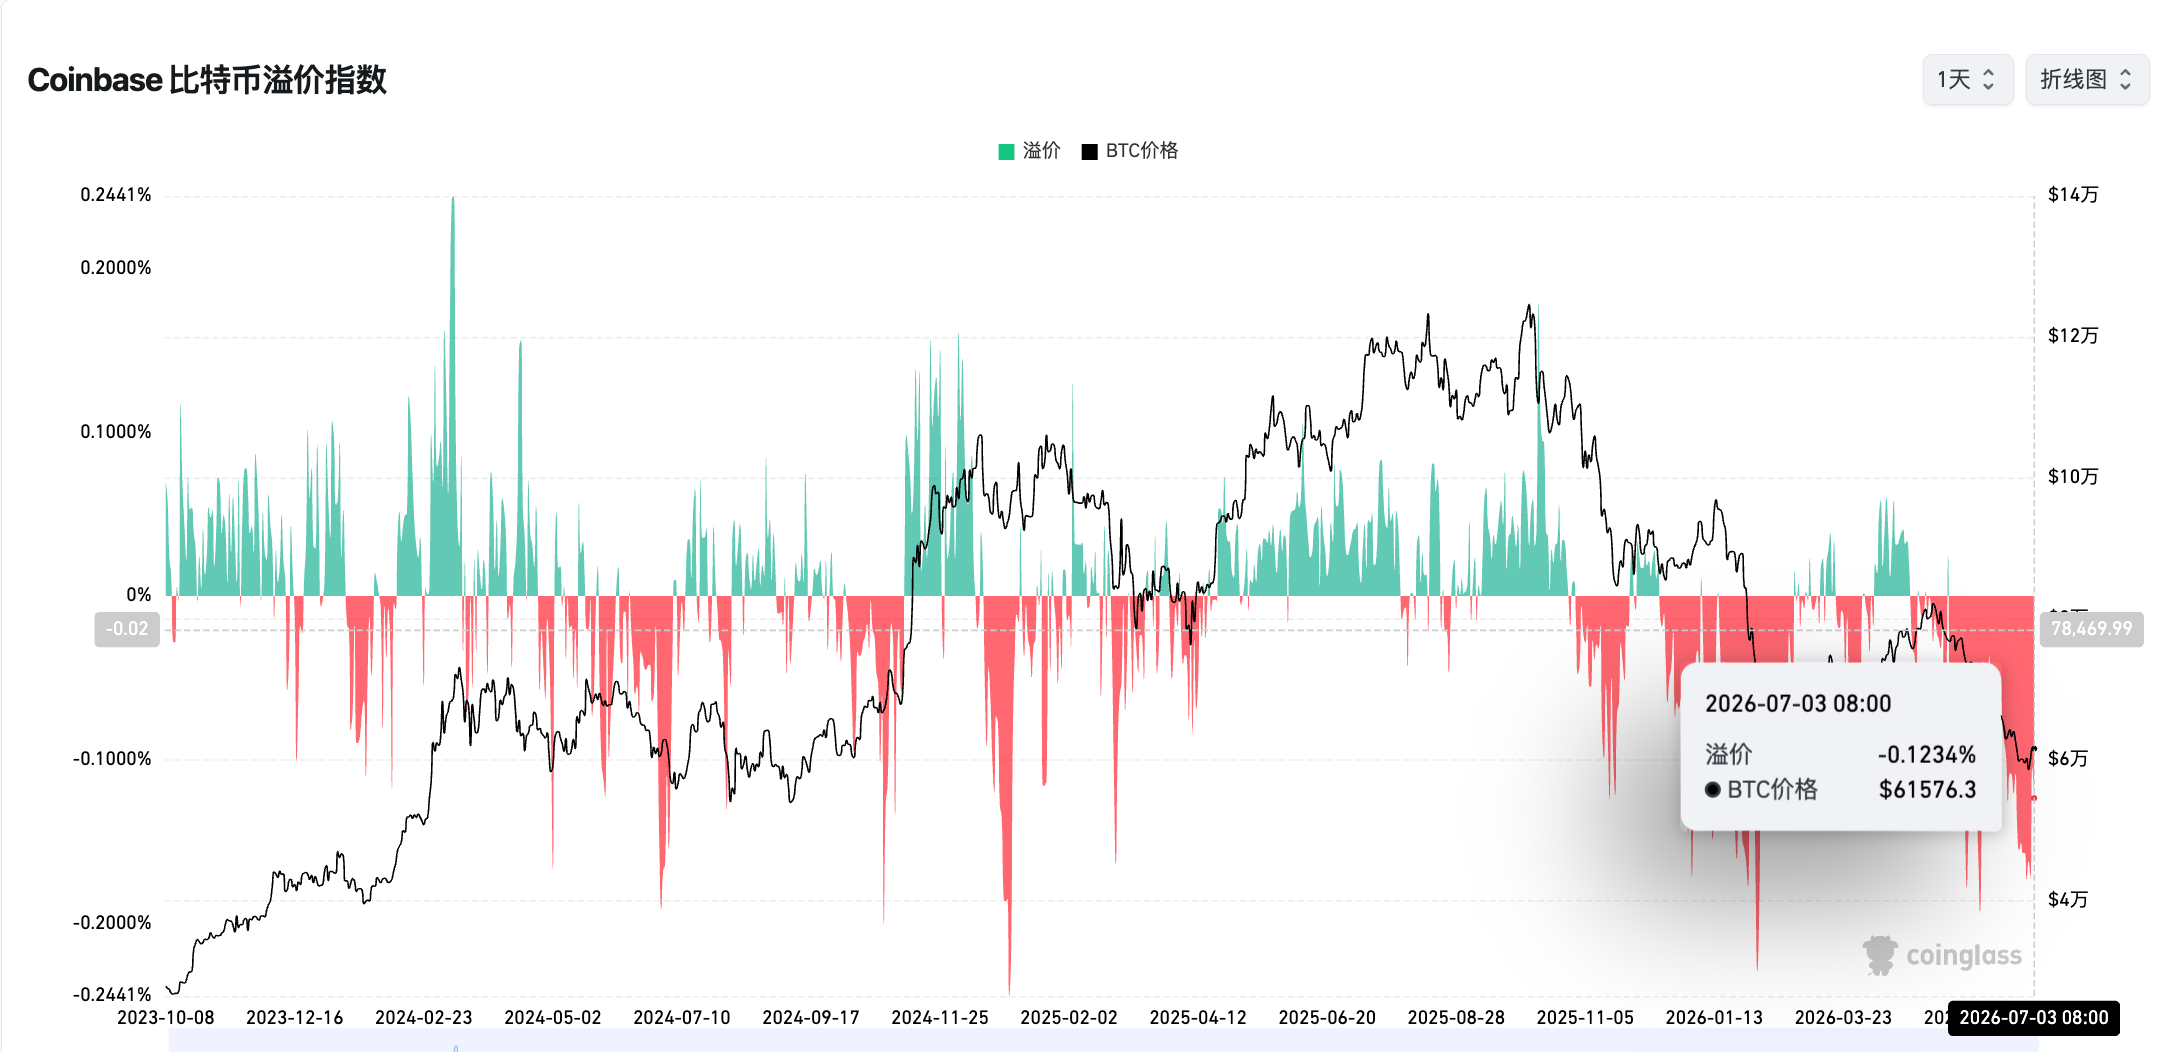
Additionally, returning to the Coinbase Bitcoin premium index mentioned at the beginning of the article, it is currently still at the -0.123% stage. Looking at the previous positive range, BTC price needs to rebound to around $77,000 for this index to have a chance to return to positive.
In summary, without strong external positive incentives, this bear market will last at least another 2-3 months, with late September to early October being the determining window for whether BTC can rebound.
Recommended Reading
免责声明:本文章仅代表作者个人观点,不代表本平台的立场和观点。本文章仅供信息分享,不构成对任何人的任何投资建议。用户与作者之间的任何争议,与本平台无关。如网页中刊载的文章或图片涉及侵权,请提供相关的权利证明和身份证明发送邮件到support@aicoin.com,本平台相关工作人员将会进行核查。


