The tsunami of sell-offs in the cryptocurrency market shows no signs of stopping, and instead, it is intensifying. Following the early morning of the 25th when Bitcoin fell below the $60,000 mark, late at night Beijing time on the 25th, the market once again faced a wave of devastating selling pressure. The largest cryptocurrency by market capitalization, Bitcoin, lost its defense line completely, and the price plummeted, nearing the $58,000 level.
At the same time, the decline in Ethereum has been even more severe, easily breaking through the important psychological barrier of $1,600, and even approaching the $1,500 edge at one point, creating an atmosphere of extreme panic in the overall market.
Today, there has been some recovery; as of the time of writing, Bitcoin is priced at $59,460, with a 24-hour decline of about 1.95%; Ethereum has also seen a rebound, priced at $1,553, with a 24-hour decline of about 3.24%. The downward trend has not yet stabilized.
This sell-off is not caused by a single event but is the result of multiple negative factors: over the past 30 days, $6.4 billion has flowed out from the US spot Bitcoin ETF, setting a record for the largest outflow in a single month; institutions are clearly de-risking, and buy-side support is rapidly shrinking; MSTR holds nearly 850,000 Bitcoins, raising concerns that its financial pressures may lead to forced selling, thereby deepening the psychological burden on the market; recently, the Federal Reserve Chairman has taken a hawkish stance, causing market participants to lower their interest rate cut expectations, with the yield on 10-year US Treasuries consistently around 4.45%, increasing the opportunity cost of holding zero-yield assets, which weakens the relative appeal of crypto assets; there has been a general sell-off in US technology and semiconductor stocks, with risk-averse sentiment spreading to the crypto market, resulting in indiscriminate liquidation of risk assets.
Bitcoin four-hour chart
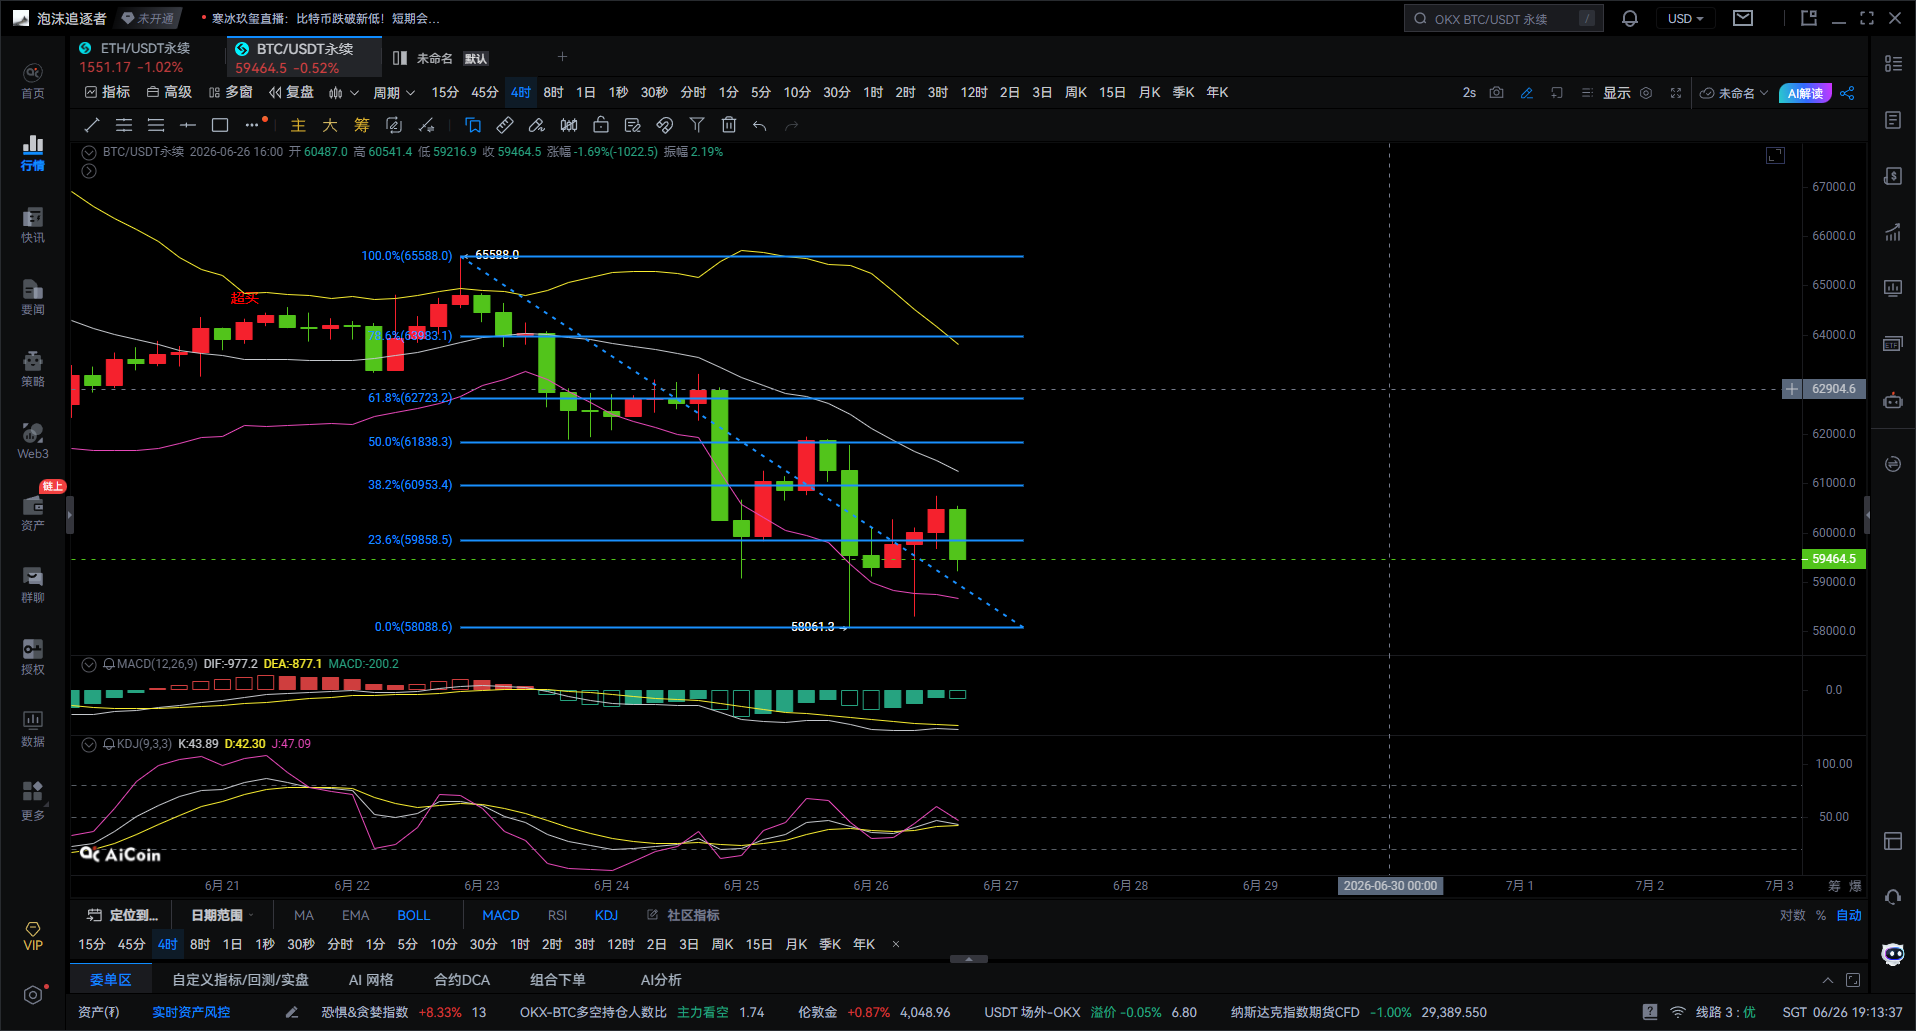
From this chart, it can be seen that the market is still swinging within a downward trend, but do not panic just yet. After two dips into the 58,000 to 59,000 region, the bears have lost some of their previous strength, and the bulls are starting to attempt a counterattack. Analyzing indicators like Fibonacci retracement, MACD, and KDJ suggests that the market is currently in a phase of bottom-building and consolidation. In the short term, there is a demand for a rebound, but in order to confirm a reversal, it must break through several key resistance levels.
Let’s first discuss the Fibonacci retracement. The current high is at 65,588, and the low is around 58,089. The key levels are as follows: The 23.6% retracement is at 59,858, 38.2% is at 60,953, 50% is at 61,838, 61.8% is at 62,723, and 78.6% is at 63,983. The price is currently hovering around 59,460. Today, there was another attempt to break through the 23.6% retracement level, but it still did not stabilize, indicating that the $60,000 integer mark is under significant pressure. If the price can hold above the 59,850 to 60,000 region, then the next target would be the 38.2% retracement level at 60,950. If it breaks through 60,950 with volume, there is hope for the market to continue upward to the 61,830 to 62,720 area. However, if it cannot break through $60,000, the price is likely to continue fluctuating around $59,000.
Now let’s take a look at MACD. The current situation is very clear; DIF is still below DEA, and both lines are below the zero axis, but the green energy bars are continuously shortening. What does this indicate? Although the bears still hold the advantage, the momentum of the sell-off is not as strong as it was a few days ago. The ongoing shorter green bars suggest that the market is entering a recovery phase. As long as the price can stabilize above $59,000 in the next few four-hour sessions, it is likely that MACD will form a low-level golden cross. Once the golden cross occurs, the rebound strength will be stronger. Therefore, the current signal from MACD is that the bears are weakening, rather than accelerating downward.
Next is KDJ. Currently, K is at 43, D is at 42, and J is at 47; the three lines are starting to turn upward. This indicates that short-term buying has returned. Compared to the previous round of increases, this time KDJ has not entered the overbought region, meaning there is still room for upward movement. However, it is important to note that the three lines are still concentrated around 50, indicating that market sentiment is merely recovering and is far from the strong upward phase. If KDJ can break above 80 in the future, that would indicate an entry into a primary upward trend; otherwise, it remains a consolidation phase.
In summary, since the drop from 65,588, a blue downward trend line has been consistently capping the market, which has not yet been broken. Each rebound is suppressed by this line. Therefore, to truly change the trend, at least two things must be accomplished: stabilize above $60,000 and break the downward trend line. Only when both conditions are met can the market confirm a short-term bottom; otherwise, any increase can only be considered a technical rebound within a downward trend.
For the subsequent trend, the first scenario, which has the highest probability, is that the 59,000 area continues to build a bottom, then breaks through 60,000 with volume, targeting first at 60,950, and after stabilizing effectively, look toward 61,830, and if strong, it could reach 62,720. The second scenario is a consolidation washout, with prices grinding back and forth between 59,000 and 60,000 to digest the trapped positions above, and MACD forming a golden cross while KDJ repeatedly flattens out; although this is a tedious process, it is part of the bottom building phase. The third scenario is if the bears regain strength; if 59,000 breaks again, it will retest the previous low of 58,090; once that fails, the downside will open up, potentially leading to a new round of accelerated decline.
In conclusion, I believe that the four-hour market has entered a phase of bear exhaustion and bottom recovery. The shortening of the MACD green bars indicates weaker bears; the KDJ low-level golden cross shows short-term capital inflow; according to Fibonacci, 59,850 to 60,000 is key. My thinking is clear: if 59,000 holds, continue to watch for a consolidation rebound; if it stabilizes above 60,000, look toward 60,950; if it breaks 60,950, look to 61,830 or even 62,720. However, until the range of 61,800 to 62,700 is truly recovered, I will not easily claim that a bull market has restarted. It still appears to be a rebound, not blindly chasing highs, and patiently waiting for key resistance levels to be broken with volume before following the trend has a higher win rate.

It is better to give you a correct mindset and trend than a hundred percent accurate advice. Teaching someone to fish is better than giving them fish; advice may earn you for a moment, but learning the approach will earn you for a lifetime!
Time of writing: (2026-06-26, 19:13)
(Article - Author’s Commentary on Cryptocurrency) Disclaimer: There may be delays in online publication; the above suggestions are for reference only. Investing involves risks; please be cautious when entering the market!
免责声明:本文章仅代表作者个人观点,不代表本平台的立场和观点。本文章仅供信息分享,不构成对任何人的任何投资建议。用户与作者之间的任何争议,与本平台无关。如网页中刊载的文章或图片涉及侵权,请提供相关的权利证明和身份证明发送邮件到support@aicoin.com,本平台相关工作人员将会进行核查。