One of XRP's most crucial 2026 support zones is back. The asset is once again trading close to the lows that once sparked intense buying interest, following months of steady decline and a clear breakdown below important technical levels.
Is it in favor of bulls?
The chart is still flawed technically. The crucial $1.28 support area, which had kept price action under control for the majority of the spring, was recently lost by XRP. A multi-month consolidation structure was rendered invalid by that breakdown, which also set off a wave of selling that drove the token into the $1.05-$1.10 range. Since then, the 50-day moving average has capped each attempt at recovery, demonstrating that sellers are still in charge of the overall trend.
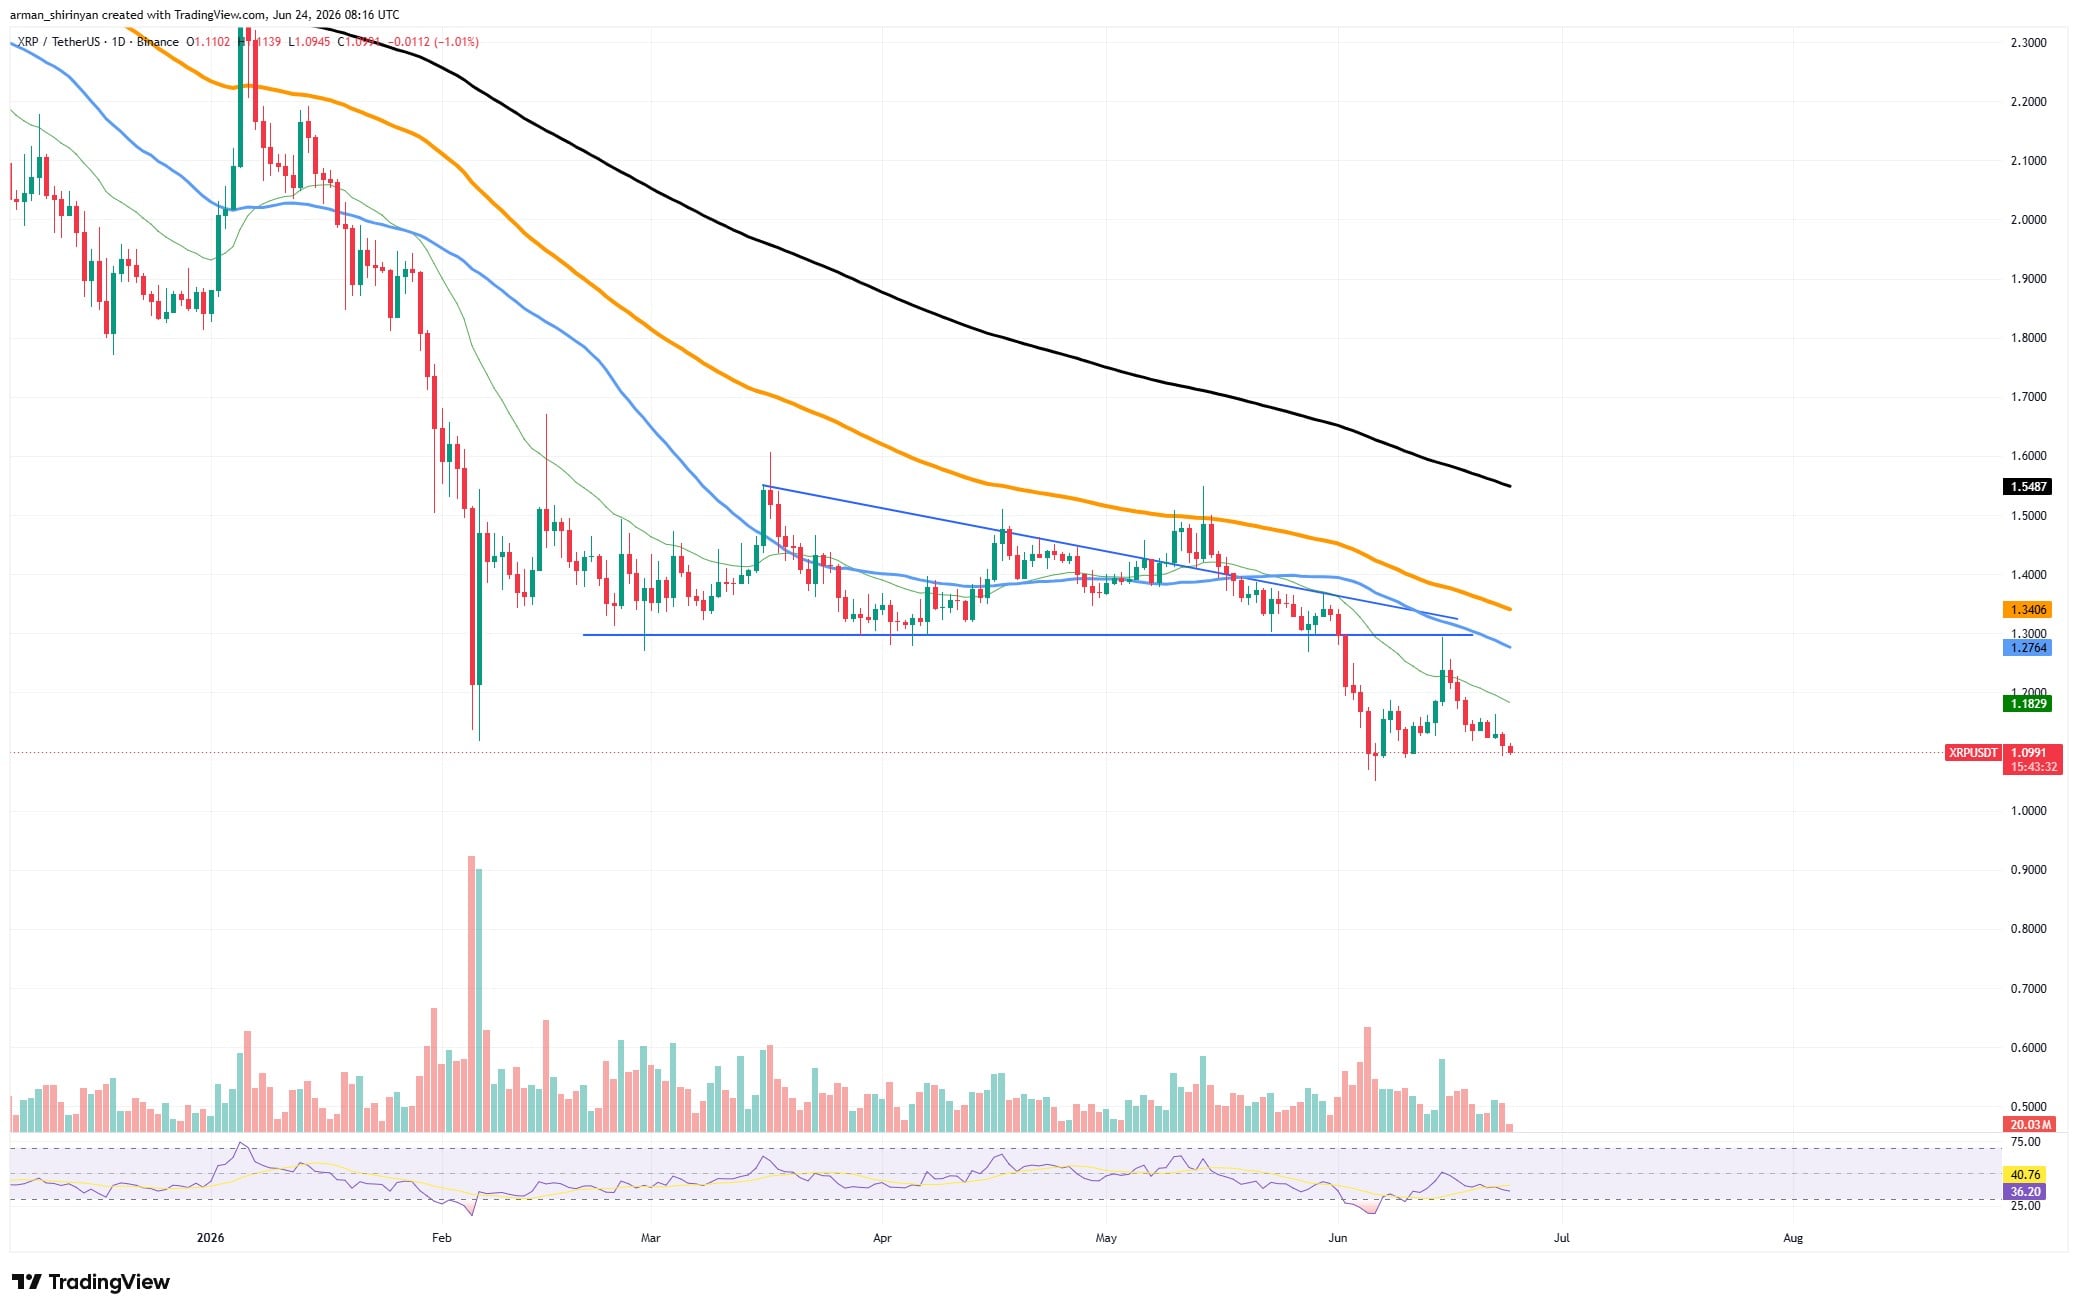
XRP/USDT Chart by TradingView
There are grounds for cautious optimism, though. The area that generated a significant reaction earlier this year is the same as the current price zone. In the past, markets have tended to revisit significant support levels prior to setting long-lasting bottoms. This indicates that the downward momentum may be nearing exhaustion, but it does not ensure a reversal.
HOT Stories Ripple: Crypto Is Quietly Becoming New E-Commerce Shiba Inu (SHIB), XRP, Bitcoin (BTC) and Hyperliquid (HYPE) Price Analysis For June 24: Volatility Spike in the Wrong Direction
There are conflicting results from on-chain activity. Over the past month, both the number and volume of XRP payments have significantly decreased, indicating a decline in network activity and a decrease in speculative activity. Transaction counts have trended downward, and payment volume, which had previously surpassed one billion XRP during active periods, has significantly decreased.
XRP's pissimistic overview
Such metrics would typically support a pessimistic view. However, when sentiment and activity are at their lowest, markets frequently bottom out. Often, prices have already begun to rise by the time on-chain metrics start to improve.
You Might Also Like

Tue, 06/23/2026 - 15:17 Tron Flips Ethereum and Solana With 3.93M Daily Active AddressesByCaroline Amosun
Stabilization is also evident in momentum indicators. Despite ongoing price weakness, the Relative Strength Index is still close to oversold territory and has stopped hitting new lows. During late-stage selloffs, this kind of divergence frequently occurs.
Bulls' immediate goals are straightforward: recover the 50-day moving average close to $1.18 and defend the $1.05–$1.10 support zone. If that occurs, the larger resistance cluster around $1.28-$1.34 may soon come into focus.
However, investors should not presume that a bottom always indicates a reversal. XRP is still in a bearish trend and below all major moving averages. The asset may have returned to its 2026 lows, but whether it continues to rise or not will ultimately depend on buyers demonstrating their ability to absorb supply and rebuild market confidence.
免责声明:本文章仅代表作者个人观点,不代表本平台的立场和观点。本文章仅供信息分享,不构成对任何人的任何投资建议。用户与作者之间的任何争议,与本平台无关。如网页中刊载的文章或图片涉及侵权,请提供相关的权利证明和身份证明发送邮件到support@aicoin.com,本平台相关工作人员将会进行核查。


