Cryptocurrency Expert: What are the Key Support and Resistance Levels for Bitcoin (BTC) on June 23? Latest Market Analysis
The current price of Bitcoin is 64,700. The market is currently stuck in a typical range-bound oscillation, with fluctuations in both directions, making it difficult to break out into a one-sided trend in the short term. This sideways phase tests one's determination, and there is no need to rush into the market to gamble on short-term price differences. Trading is not about the frequency of operations but about risk control and mindset. Maintain the bottom line of your position, endure the loneliness, and wait for a directional breakout. The market always has opportunities; maintaining rhythm and protecting the principal is key to securing profits when the situation clarifies.
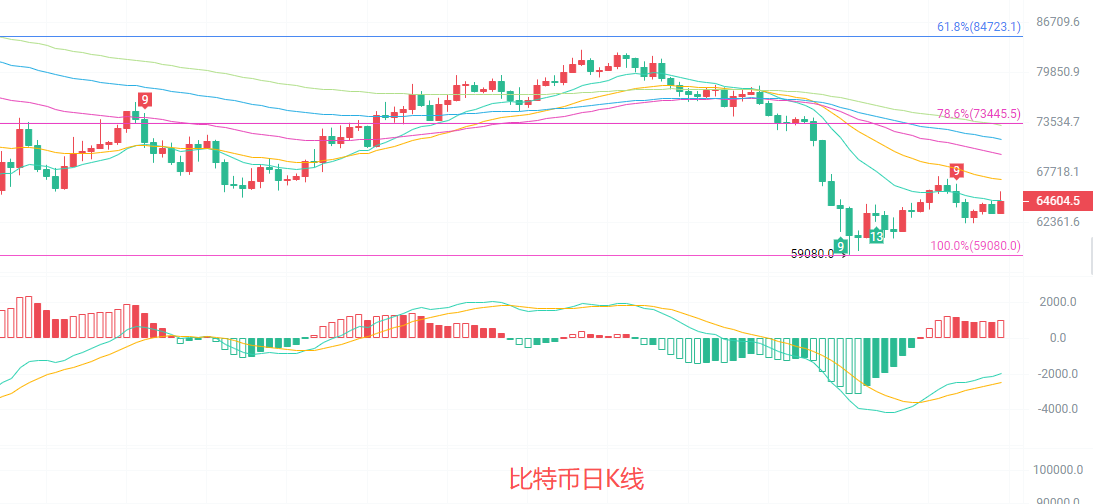
The daily candlestick price is still in the repair phase following a downward trend, currently under pressure from the EMA15 and EMA30, and has not yet crossed the key moving averages. MACD shows a significant decrease in bearish momentum, with a slowing downtrend. Regarding the Bollinger Bands, the price is between the middle band at 63,583 and the upper band at 66,494, with the oscillation range narrowing. The lower support is at the previous low of 59,080, and the first resistance above is at the Fibonacci 78.6% level of 73,445. Overall, it remains in a weak recovery state after the decline, without a clear reversal signal yet.
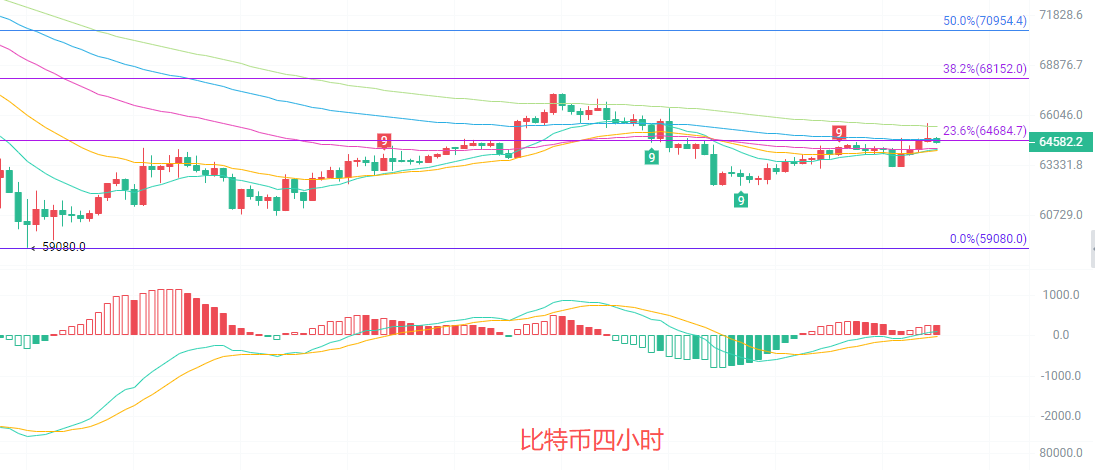
The four-hour candlestick operates above the EMA15 and EMA30, with short-term moving averages providing support. The upper side is under pressure from the EMA60 and EMA90, with the moving average system flattening after a downward arrangement. MACD shows a short-term release of bullish momentum. The Bollinger Bands are narrowing, with the price close to the upper band, and the lower support is at the Bollinger middle band of 63,964. The upper resistance is at the Fibonacci 23.6% level of 64,684. Overall, it shows a narrow oscillation with a slightly bullish repair trend, and the trading volume is moderate, without any obvious trend-breaking signals yet.
Short-term reference: The market is never 100% certain, so always set proper stop-loss orders. Safety first — small losses but big gains are the goal.
If the price doesn't break below 64,200 to 63,700, it may head up, with a stop-loss at 63,200, targeting 65,500 to 66,500.
If the price doesn't break above 65,500 to 66,000, it may head down, with a stop-loss at 66,500, targeting 64,500 to 63,500.
The specific operation should be based on real-time data from the market. For more information, you can consult the author. The publication of this article may be delayed; it is recommended for reference only, and the risk is borne by the reader.

Kind Reminder: The above content is solely created by the author of the public account. The advertisements at the end of the article and in the comments section are unrelated to the author. Please discern carefully. Thank you for reading.
免责声明:本文章仅代表作者个人观点,不代表本平台的立场和观点。本文章仅供信息分享,不构成对任何人的任何投资建议。用户与作者之间的任何争议,与本平台无关。如网页中刊载的文章或图片涉及侵权,请提供相关的权利证明和身份证明发送邮件到support@aicoin.com,本平台相关工作人员将会进行核查。