Reveal the true business model of Collector Crypt: Is it a collector platform or a high-speed casino?
Written by: Four Pillars (@FourPillarsFP)
Translated by: AididiaoJP, Foresight News
Key Points
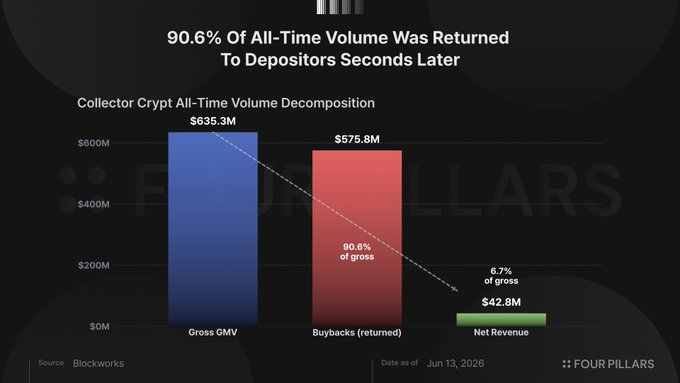
- Collector Crypt (CC) has accumulated total revenue of $635 million, of which 90.6% is returned to users through instant card buybacks, with net income of only $43 million and a retention rate of 6.7%.
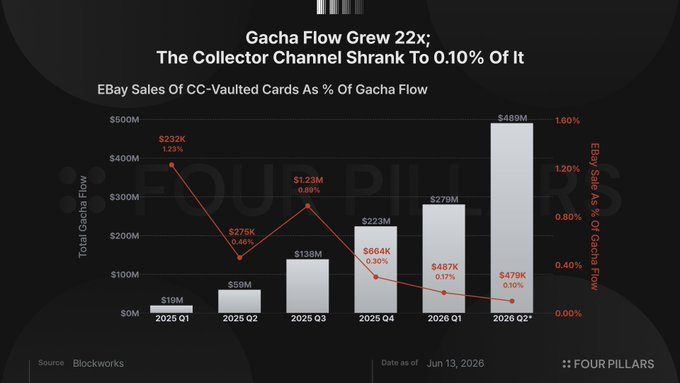
- The total secondary trading across all channels is less than $5 million, with eBay's share dropping from 1.23% to 0.10% (decreasing for six consecutive quarters).
- The value capture of tokens (burning + buybacks) totals only $1.4 million, accounting for 3.4% of net income, while the operational wallet has off-ramped $45.7 million USDC.
- As the scale shifted threefold towards high-tier card packs, net margins were halved from 11.2% to 5.8%. With each increment in tier value, mixed profit margins were further dragged down.
- The current approximate $535 million FDV corresponds to 7.3 times net income, representing a "casino" with continuously compressed margins, about 420 active players daily, a float ratio of 20.5%, and 72% of insider supply locked until November 2027.
Introduction
You deposit $1,000 into Collector Crypt, open a Grail card pack, and receive a tokenized Pokémon card valued at $1,015 by the platform. It seems you've made a profit. Turbo mode automatically activates, selling the card back to the protocol at a 93% buyback rate, and you instantly receive $944. The entire cycle takes just a few seconds.
This cycle is quickly replicated by hundreds of wallets, generating $635 million in transaction volume and creating an approximate $535 million FDV for the CARDS token. This article will break down the composition of these volumes, whether the pricing of the collectible within the token economy is imminent, and how much share tokens can derive from revenue.
Note: Collector Crypt (referred to as CC) is an on-chain gacha (capsule toy/blind box) platform that combines physical collectible cards (mainly graded Pokémon, sports cards, etc.) with NFTs. Users deposit USDC to purchase randomly priced card packs ($25 to $2,500+), and upon opening, receive an NFT card backed by physical graded cards, with the platform offering 85%~93% instant buybacks (Turbo mode is defaulted to on), allowing users to sell cards back to the platform for USDC within seconds, creating a rapid cycle.
What the $635 million actually is
90.6% of the accumulated volume is returned to users within seconds
The core product of CC is a gacha machine. Users deposit USDC to purchase random card packs ($25 to $2,500, there is a $5,000 tier in the API but it has not been publicized), receiving an NFT card backed by physical graded cards. Each card has an "insurance value," and the platform provides an 85%-93% instant buyback.
Buyback is a default behavior rather than an exception. All 33 machine configurations in the CC API have turboMode: true enabled. Cards automatically sell back to the protocol, and users receive USDC after deducting the price difference within seconds.
According to Blockworks data as of June 13, total revenue reached $635 million, of which $576 million was returned to users through card buybacks, resulting in $43 million net income and a retention rate of 6.7%. Here, "buyback" does not refer to token buybacks, but rather the platform repurchasing the cards that were just sold, recycling the same deposit into the next draw.
On the ATH day of June 11, the machine processed $10.6 million in transaction volume, retaining $881,000, with a retention rate of 8.3%.
DeFiLlama adapter source code confirms this breakdown: dailyFees = pack_purchases + royalties - buybacks, meaning that the approximately $52 million annualized fees displayed on the dashboard are already net of buybacks. dailyVolume = pack_purchases, which is gross expenditure prior to recycling, and this is also the figure shown on the protocol volume leaderboard.
Transaction volume is highly concentrated among a few wallets
Blockworks counts a cumulative user base of 23,333. In May 2026, the platform had approximately 420 daily active users, averaging $3.3 million in daily volume, which translates to about $7,800 per user daily. Even if 400 of those 420 users each spent $1,000 daily, the remaining 20 wallets would still contribute $2.9 million, accounting for 87% of the total. Such extreme concentration is a mathematical inevitability of averages.
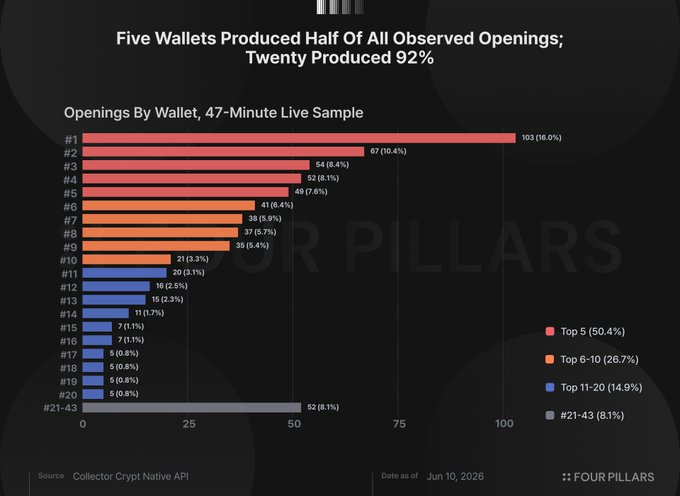
Actual activity also corroborates this point. We polled CC's public prize-winners 20 times within 47 minutes on June 10, filtering by NFT address. The sample included 645 pack openings from 43 wallets. The top 5 wallets contributed 50.4% of the openings, the top 10 accounted for 77.1%, and the top 20 made up 91.9%. The most active single wallet contributed 103 openings, accounting for 16% of the total.
This is just a 47-minute window, not a full-time distribution. However, averages and samples point in the same direction: this $635 million is a casino with a retention rate of 6.7% fed by a few high-frequency players at industrial speed.
The collector market has yet to arrive
Bull Market Argument
The strongest bull market version is worth mentioning: the buyback cycle itself is the product. The draw itself is entertainment, with an 85%-93% return rate implying users incur slow losses, while the instant liquidity of physical cards in the vault represents a product innovation. As a consumer design, this is defensible.
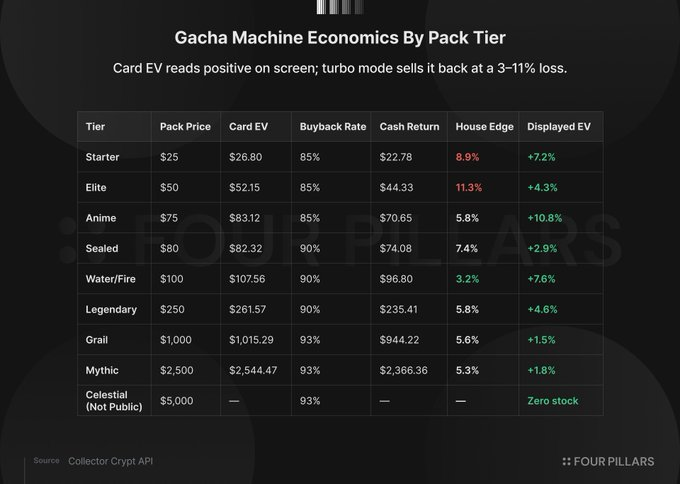
However, the machine configuration reveals the direction for design optimization. CC independently controls two variables: the insurance value allocated to cards, and the buyback rate for automatic resale in turbo mode. The tier ranges and vault inventory are configured to ensure that the expected card value weighed by probabilities exceeds the card pack price. The buyback rate further discounts this value below the price.
For instance, a $1,000 Grail card pack shows an expected card value of $1,015, giving users a +1.5% proposition. Turbo mode activates with a 93% buyback rate, returning $944 in cash. The card's expected value exceeds the card pack price, and the card pack price exceeds the cash return, allowing users to see the former in comparison, while the platform profits from the latter. All tier structures are the same, achieving edges from 3.2% to 11.2%.
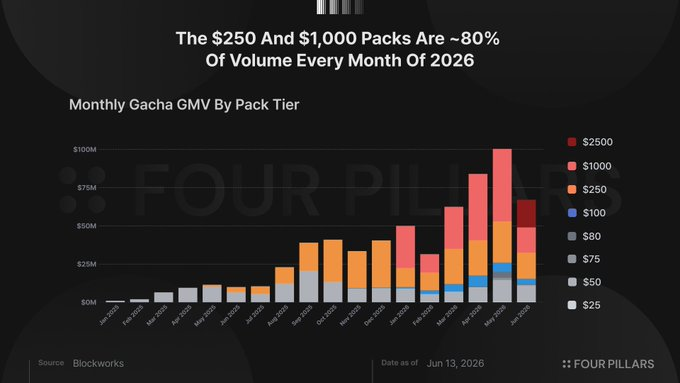
The spending structure confirms user types. In 2026, monthly, the $250 and $1,000 tiers comprise about 80% of the total (January 79.4%, March 80.6%, April 79.4%). Collectors will buy specific cards at specific prices to complete certain sets. The distribution dominated by $1,000 random card packs is characterized by high-spending players.
Secondary transactions below 1%, eBay's segment dropped 12 times
If collectors were using this platform, they would trade with each other, and cards would flow into a broader market. CC data tracks both, and both are close to zero.
Within the platform, cumulative marketplace royalties total $133,000. Of the $6.9 million lifetime marketplace volume, only $823,000 represented real peer-to-peer transactions, while the remainder was buyback flows and legacy volume from V1.
Outside the platform, Blockworks tracks eBay sales of CC vault cards. The cumulative total is $3.4 million, with the trend being the key finding. As a share of gacha flows, eBay was at 1.23% in Q1 2025, 0.46% in Q2, 0.89% in Q3, 0.30% in Q4, 0.17% in Q1 2026, and 0.10% in Q2. During the same period, gacha volume increased approximately 25 times. The absolute value for the collector channel has hardly changed, but its proportion has plummeted by 12 times.
Of the $635 million card value generated by the platform, only $18.5 million was redeemed for physical cards, accounting for 2.9%. The remaining 97% were sold back to the protocol through automatic buybacks, with most completed within seconds.
The total actual secondary activity across all channels (eBay + peer-to-peer marketplace transactions) is under $5 million, while gacha throughput reached $635 million. A standard bull market rebuttal is "it's too early," but the quarterly eBay sequence answers this question. The platform is not on an early path toward collector behavior; rather, for six quarters, it has been significantly distancing itself from this behavioral pattern.
Turbo mode eliminates the dwell time on which collectors' platforms rely to monetize—browsing, comparing, and collecting cards—these times build secondary markets. The design optimization is for the speed of cycles, not for discovery. These are two different products.
Token Uses
The revenue of CC flows through three layers. Users deposit USDC to buy gacha card packs, receiving random card NFTs, which are almost always sold back at an 85%-93% buyback rate. The platform retains a 7%-15% spread as net income. Secondary revenue lines include a 2% marketplace transaction royalty and a 2% fee when users redeem NFTs for physical cards. All net revenues flow into the operating treasury for card stock purchases, USDC off-ramping, and a small token buyback plan starting in June 2026.
Volume tripled, margins halved
According to Blockworks daily data, Q3 2025 gross volume was $75 million, net margin 11.2%; Q4 gross volume was $116.3 million, net margin 5.7%; Q1 2026 gross volume was $145.9 million, net margin 5.9%; Q2 gross volume as of June 13 was $256 million, net margin 5.8%.
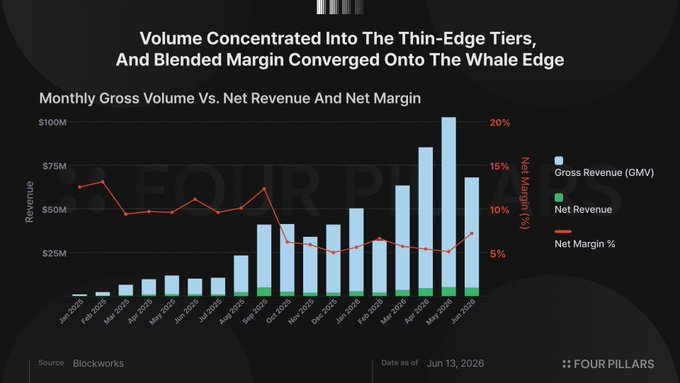
The compression is structural. The thinnest margins are precisely where the largest volumes are—$250 and $1,000 card packs have about 5%, while $25 and $50 tiers have 9%-11%, because high-volume players wouldn’t cycle six-figure funds at an 11% spread. As the volume concentrated toward higher tiers, the mixed profit margin converged toward the upper bound. The growing marginal dollars come from the least retained players of the platform.
The $2,500 Mythic card pack launched on June 10 has a profit margin of 6.4%. There is already a $5,000 Celestial card pack in the API (currently out of stock). With each increment in tier value, gross volume continues to grow, while pulling the mixed profit margin toward the high-tier lower limit.
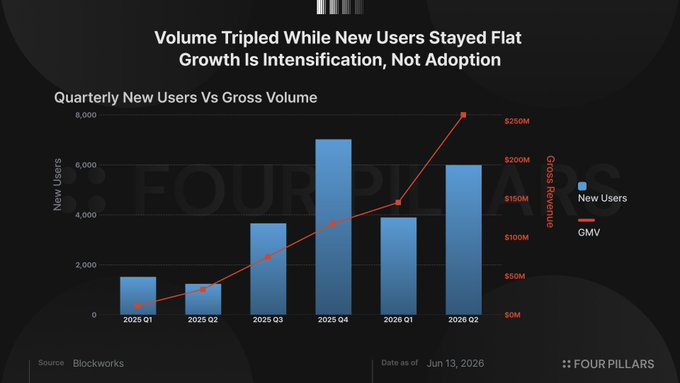
User data confirms growth is reinforcement rather than expanded adoption. The number of new users in the last four quarters was 3,668, 7,013, 3,886, and 5,982 (Q2 as of June 13), roughly flat, while volume has tripled. In May 2026, 2,593 new users were added, but daily active users increased from about 280 in April to 420 in May. Most new users churn within days.
Token value capture: $55,900 in burns + $887,000 in buybacks
Since its launch, 294,203 CARDS tokens have been burned, accounting for 0.015% of the supply, valued at about $55,900 in 9.5 months. CC documentation does not specify the mechanism triggering burns, and the downward trend coincides with the market activity collapse. In May 2026, 372 tokens were burned, and in June, 21 tokens were burned, valued at $4.
On June 13, Lukas Ruppert from Maelstrom published on-chain evidence linking token purchases to wallets associated with CC's operational infrastructure. Ruppert traced back from CC's known operating center (DFEst) through Kraken to DCA bots, identifying associated wallets with pack opening histories. He did not fully confirm team control, but noted, "If these wallets are indeed controlled by the team, the implications are far beyond the purchases themselves," with strong circumstantial evidence.
The on-chain traces show two incidents. On May 12, CARDS Aggregator wallet paid $500,000 to pre-seed investor GSR via Fireblocks custody, acquiring 4,045,013 CARDS at around $0.124 each. Then, on June 10 and 11, newly created wallets funded through Kraken began buying CARDS in the market via DCA bots, deploying about $625 and $587 every 2-6 minutes in parallel flows. By June 12, the bots had deployed $159,000, accumulating 599,104 CARDS, with a remaining budget of $728,000.
Calculating all forms of token value capture: burns ($55,900), GSR settlement ($500,000), total DCA budget including undeployed funds ($887,000), totaling $1.4 million, which represents 3.4% of the platform's cumulative net income of $43 million. At the current annualized rate of about $73 million for Q2, the entire DCA budget amounts to 1.2 times the net income for a year.
Ruppert identifies wallets associated with CC's operating center that have off-ramped $45.7 million USDC, including $8.5 million since May 2026. Regardless of whether these wallets are controlled by the team, this disproportion is noteworthy: $1.4 million flows toward tokens while $45.7 million flows out of tokens. Buybacks may mark the beginning of sustained value capture, but at the same time, the plan has no on-chain, automated, or committed elements and could stop tomorrow.
At a 5.8% net margin, significantly increasing token buybacks versus operating wallet income is a zero-sum game. The buyback rate (85%-93%) determines players' costs per round; lowering it would drive down volume, hence total profit margins are determined by players' willingness to absorb. Within this margin, token buybacks and operating outflows contest the same pool of funds.
Even at face value, with an annualized rate of about $73 million at Q2 rate, the approximate $535 million FDV corresponds to 7.3 times net income, representing a casino with continuously compressed margins, about 420 players daily, and a highly concentrated revenue base (single wallet exits could result in double-digit percentage movements in daily volume).
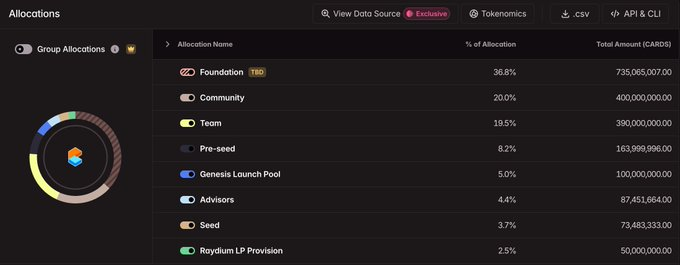
About $110 million circulating market value reflects a 20.5% float ratio, with out of 2 billion total supply, 410 million circulating. The remaining 79.5% is locked according to a public schedule until November 2027, with the next unlock on June 29 releasing 28.84 million tokens distributed among four allocations. Insider allocations make up 72% of the supply (foundation 36.75%, team 19.5%, pre-seed 8.2%, advisors 4.37%, seed 3.67%), with 20% for the community, 5% for the Genesis Launch Pool, and 2.5% for Raydium LP.
Conclusion
CC has built a product that puts physical cards into a vault and found product-market fit with a few high-speed gamblers. Our perspective would change if marketplace royalties shift towards genuine peer-to-peer transactions, if eBay's share reverses the six-quarter downward trend, or if the scale of the buyback program exceeds 3.4% of net income. Currently, none of these are visible.
What is currently visible is: total token value capture of $1.4 million, accounting for 3.4% of cumulative net income, corresponding to $110 million market value (with $535 million FDV); operational wallets have off-ramped $45.7 million while executing $887,000 in buybacks; the collector channel has been shrinking every quarter since launch; and with a float ratio of 20.5%, insider allocations account for 72% of supply, locked until November 2027.
免责声明:本文章仅代表作者个人观点,不代表本平台的立场和观点。本文章仅供信息分享,不构成对任何人的任何投资建议。用户与作者之间的任何争议,与本平台无关。如网页中刊载的文章或图片涉及侵权,请提供相关的权利证明和身份证明发送邮件到support@aicoin.com,本平台相关工作人员将会进行核查。


