
Author: Alex Thorn, Galaxy
Translator: Jiahua, ChainCatcher
In the 17 years of Bitcoin's development, the price has always operated in long-term cycles of ups and downs. About every four years, it climbs to a frenzied peak, experiences a painful drop to the bottom, and then begins to recover again.
This rhythm has historically anchored around the halving that occurs every four years, which halves the regular new supply. Although the influence of consecutive halvings is fading and the market is filled with various predictions of "super cycles," empirical data again shows that the four-year cycle remains intact.
This report explores these fluctuations and a pattern that has emerged in Bitcoin's modern history: each time the magnitude of the fluctuation is more gentle than the last.
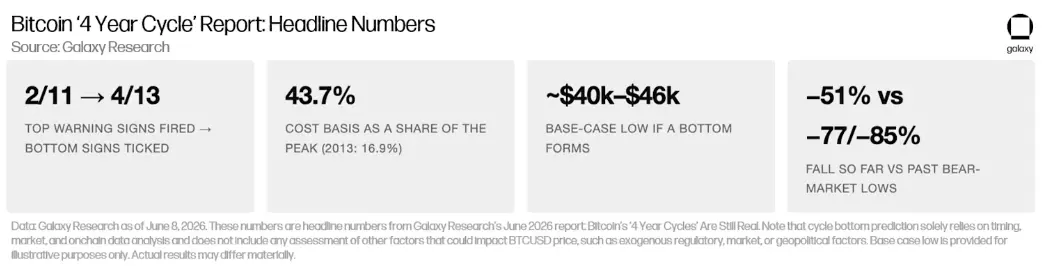
The peak in October 2025 is the calmest top in Bitcoin's history, and the subsequent drop is also unusually mild. Given that the peak is so restrained, should we expect the eventual cycle bottom to also be unusually shallow? If so, where might that bottom approximately land?
This report assumes that the current pullback's bottom has not yet been reached and provides data to support this assumption. The data also indicate that the calmer top of October 2025 may lead to a higher cycle bottom.
Historical analogies suggest that the base scenario bottom of the current pullback is between $40,000 and $46,000, roughly occurring during the period from now until the fourth quarter of 2026. (The base scenario is for illustration purposes only. Actual results may vary materially.)
The key is that this report relies entirely on market data, on-chain data, and time cycle analysis. The range of the predicted cycle bottom does not utilize or depend on assessments of the probability, timing, or impact of external events (such as regulations, market or geopolitical developments).
Is Bitcoin's "Four-Year Cycle" Still Valid?
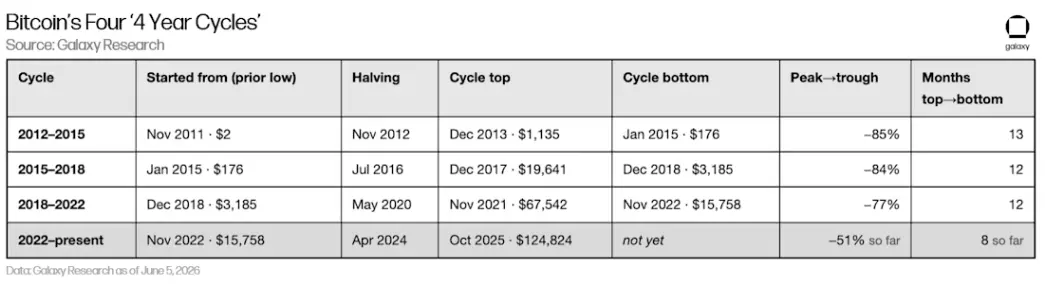
Each Bitcoin cycle involves a process from the previous low, through halving, climbing to the top, and then falling back to the next low. Here are the four cycles including the current one:

The bottom of the current cycle has not yet formed. Based on the report date of June 9, 2026, its pullback magnitude and time elapsed are "so far" data.
Please note two rules on which this report is based: first, the decline from peak to trough in each cycle has been shrinking (from 85% to 84%, then to 77%); second, historically each peak is followed by a bottom in approximately 12 to 13 months. The current cycle is only eight months past the most recent peak.
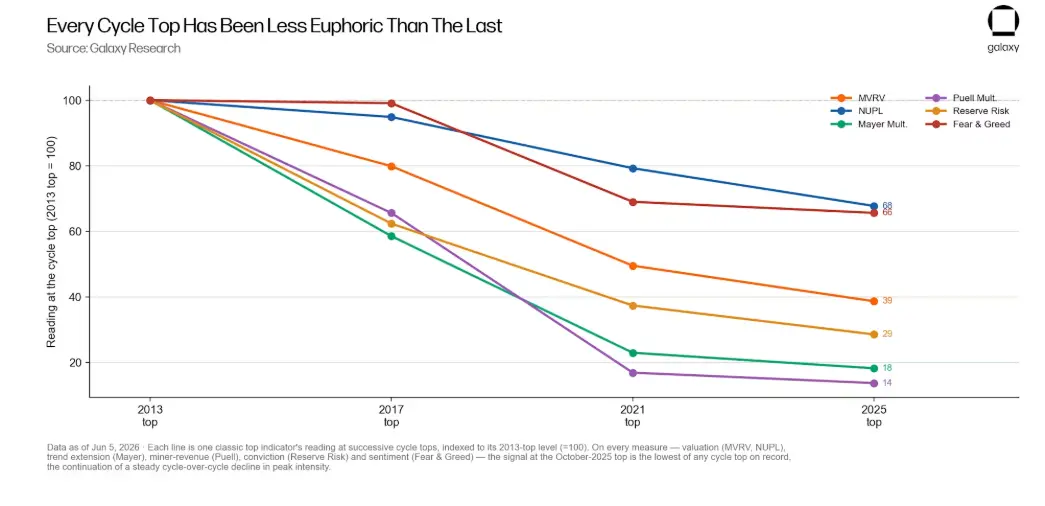
After index comparison, the top of October 2025 appears notably restrained in relation to previous cycle tops. For this reason, the average price paid for the chips in the market (i.e., the realized price, or "cost basis") is remarkably close to the historical peak, reaching 43.7% of the previous all-time high (ATH).
In contrast, this ratio in previous cycles typically ranged from one-third to even lower.
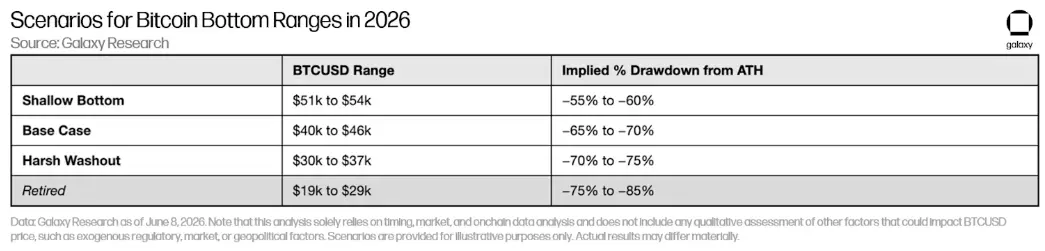
This is a critical data point: if a sell-off of the same scale as the end of past bear markets occurs, this time it will stabilize at a much higher dollar level. Comparing the timing, amplitude, and on-chain indicators of the cycles, the current pullback may bottom in the following range:
The above price levels and the analysis in the report point to our view: the bottom of this cycle has yet to be explored. The indicators of historical cycle bottoms have triggered very few; from a time perspective, the current drop is still relatively short compared to historical pullbacks; and should true panic emerge, the cost basis itself will also decline.
Our core argument is this: empirically, the four-year cycle is still valid; the amplitude of the cycles, however, has contracted. A calmer top raises the lower bound but has not eliminated it.

How to Accurately Identify Cycle Tops and Bottoms Using Data?
It is almost impossible, or at least extremely difficult, to precisely capture the formation of a top or bottom; however, in hindsight, everything seems clear. Therefore, our approach is to list the conditions that have appeared at previous tops and bottoms and see how many are currently manifesting.
To establish a set of indicators for assessing past tops and bottoms, we examined five types of evidence: valuation (how high or low is the current price relative to the average cost borne by holders?), profit-taking (are holders selling in strength or capitulating in weakness?), miners (are the participants producing Bitcoin thriving or under pressure?), trend (how much is the price deviating from the long-term mean?), and sentiment (greed or fear?).
Applying this five-dimensional perspective to both ends of the current cycle yields a clear picture: Bitcoin's volatility is narrowing. Each top exhibits less frenzy than the previous one, and subsequent crashes are becoming shallower.
If this "contraction" in amplitude truly exists and holds at both ends, it can provide valuable information for predicting the expected cycle bottom that is imminent in the current pullback. We can thereby estimate a range and predict where Bitcoin might bottom in this current pullback.
This analysis requires us to first determine the indicators, establish a baseline for identifying cycle tops and bottoms. We apply the same scoring method to both ends: comparing each indicator's level against each previous top and bottom.
Reviewing Cycle Tops
The top is real but is also the calmest one ever recorded. At the peak in October, only two of the eleven classic warning signals reached a very slight prior top level, and they only barely touched it.
The clearest valuation indicator, the market cap to realized cap ratio (MVRV, which measures how high the price is relative to the average price paid by holders), peaked at only 2.29, while the MVRV for the three previous tops ranged from 2.93 to 5.91.
The entire "greed" indicator group recorded the lowest-ever cycle top reading, while the Pi cycle top (a timing signal that has predicted previous tops within a few days) did not light up at all, which is unprecedented in Bitcoin's history.
However, in terms of timing, it is textbook level: this peak occurred on the 1,062nd day after the last low, exactly coinciding with the timing of peaks in 2017 and 2021.
The turning point is that true frenzy appeared about 18 months early, around the time the U.S. proposed a spot Bitcoin ETF, and after that, even as enthusiasm cooled, the price continued to rise. In retrospect, this appears more like institutional buying rather than the kind of retail frenzy that triggers peak surges.
The image below is the complete top indicator table for the current cycle (anchored to the historical high of October 2025).
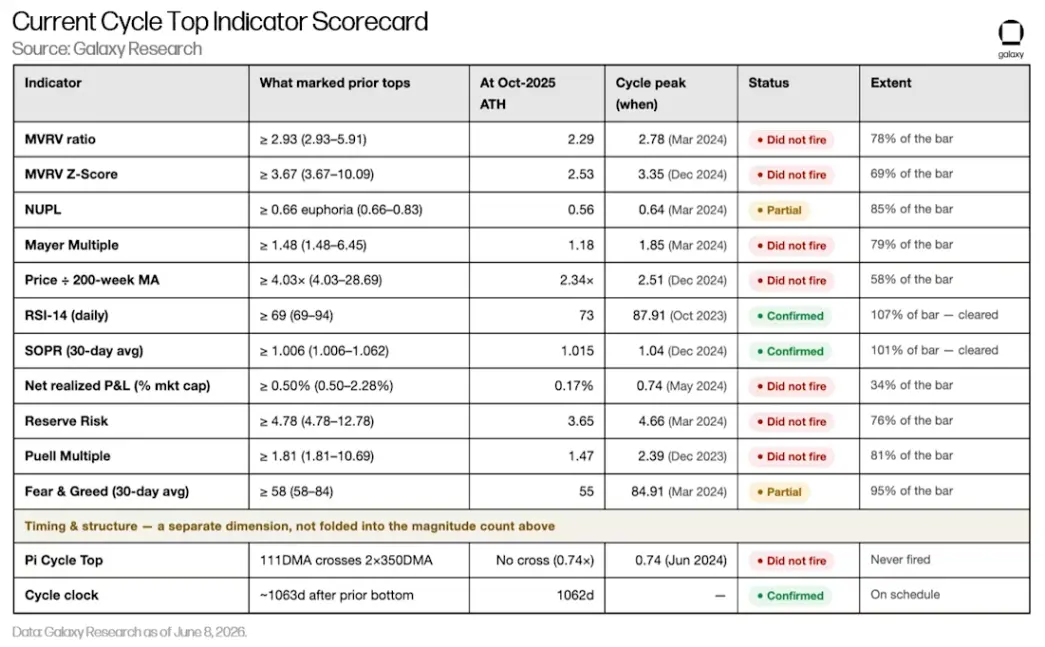
Of the eleven magnitude signals: two are confirmed, two are only partially confirmed (having reached at least 85% of the threshold), and seven did not light up. The two that were confirmed (RSI and SOPR) only barely exceeded the weakest thresholds set in 2021, both peaking in 2023 and 2024, not at the price peak in October 2025.
The key point is that although the cycle clock arrived on time, the Pi cycle top signal did not light up (the reason why time is a calendar fact and not a measure of top frenzy is that these two indicators are treated separately).
"Marks of past tops" are the range of cycle tops from 2013, 2017, and 2021; the threshold takes the least frenzied of the three (the peak in 2021), which is the easiest top-level threshold to cross. "Cycle peak" refers to the most extreme readings of each indicator in the current cycle and their respective months of occurrence. Reserve risk and Pi cycle ratio use our internal measurement scale.
Deriving Cycle Bottoms
During this pullback, only four of the thirteen bottom signals were triggered, three of which belong to weaker indicators: fear sentiment, trend indicators that touched bottom ranges, and the first drop below the 200-week moving average.
The fourth signal occurred at the beginning of June and is the first warning from the miners' side: the Hash Ribbons exhibited a recovery crossover. This means that after a period of capitulation, the 30-day average has risen back above the 60-day average—a signal that historically often indicates a bottom is coming.
However, the strongest signal that marks every true bottom (price falling below cost basis, the overall holders being in losses, continuous selling at loss, deep panic washout) has not yet emerged. The current -51% decline is still much milder than the -77% to -85% bottoms seen in previous cycles and is also shallower than the -53% decline of mid-2021.
But the rhythm has changed. Measuring from the same point in the cycle (about eight months after the peak, or 242 days) the recent decline has pushed the current drop slightly below levels seen in the 2013-2015 cycle during that same phase (when it was in a relief bounce, and the drop was -48%).
Therefore, it is no longer the shallowest path of retreat in the chart (for most of this pullback, it has been the shallowest). The cycles from 2017-2018 and 2021-2022 deepened considerably during this stage (both close to -68%). Following the cycle clock, the bear market bottom window will not open until around the end of 2026.
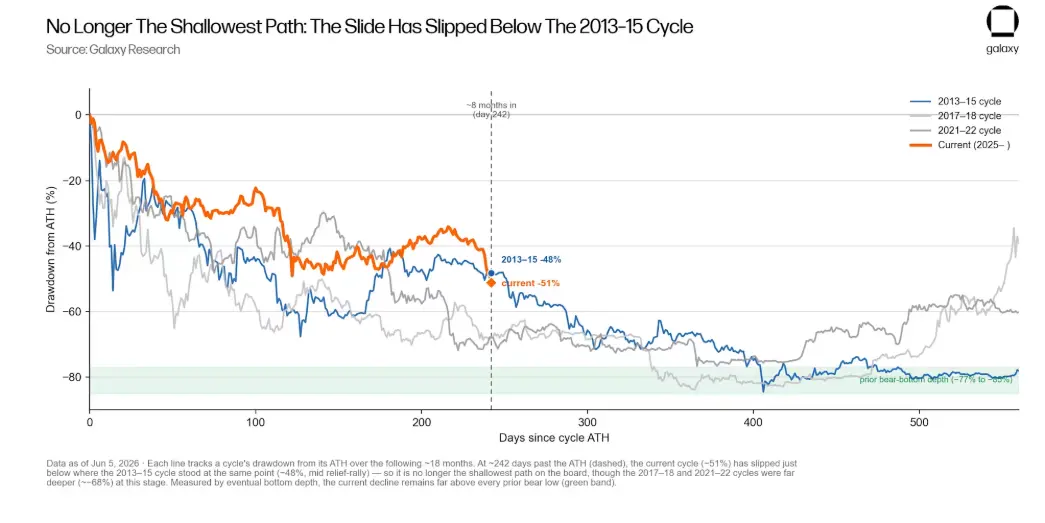
Each curve tracks the decline from the peak at the start of a cycle, aligned with day zero. By around day 242 (dashed line), the current cycle (orange, -51%) has slightly dipped below the level of the 2013-2015 cycle (-48%), making it no longer the shallowest cycle of retreat (it had been for the most part previously).
The other two past cycles during this stage approached -68%. The current level of all cycles is still far above the current price (the green band represents the bottom area of past bear markets).
The following image shows the complete bottom indicator scorecard for the current pullback, using indicators that have previously signaled cycle bottoms.
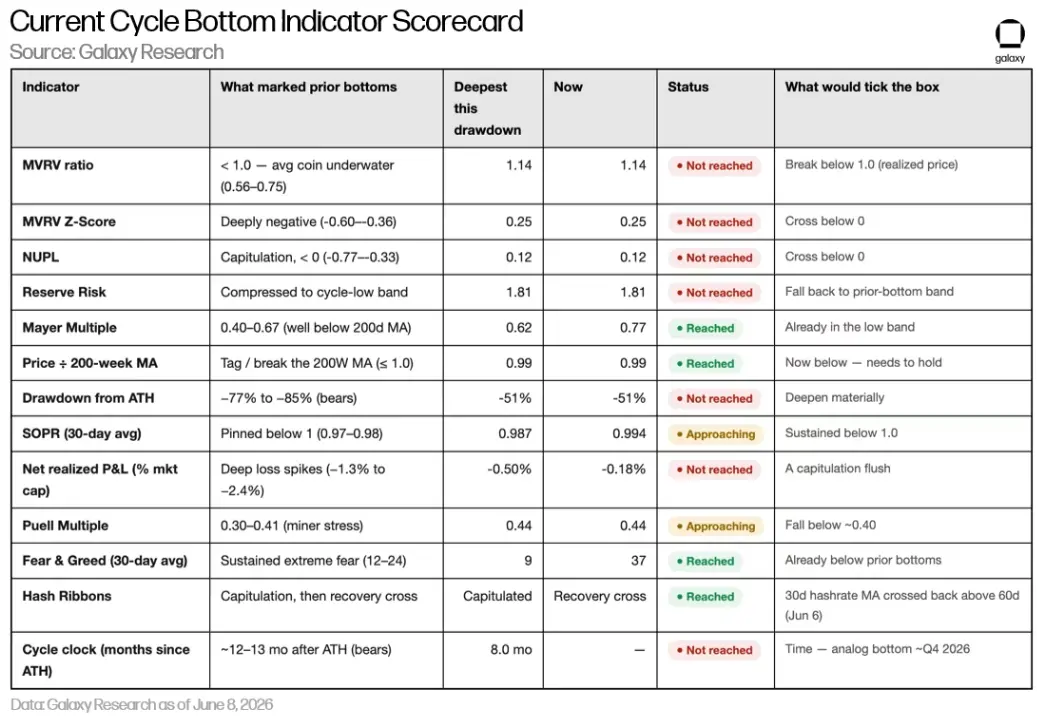
Out of 13 target indicators, 4 have been reached, 2 are nearing, and 7 have yet to be reached.
To illustrate the signals' significance from this bottom indicator set, the following table lists when they were triggered at past cycle bottoms, comparing with today.
Aligning these 13 identical signals with the last three cycles, the context becomes clear: at every bear market bottom in the past, these 13 indicators ultimately entered the bottom area, with the only difference being timing—some signaled early, while others lagged.
However, today only four signals have been triggered, with the only miner-side indicator (Hash Ribbons) recently triggered. (A significant difference is that this time the Hash Ribbons reversal seems to occur before the bottom rather than lagging as in the past. This may be due to the external effects of Bitcoin miners transitioning to artificial intelligence, a phenomenon not seen in past cycles.)
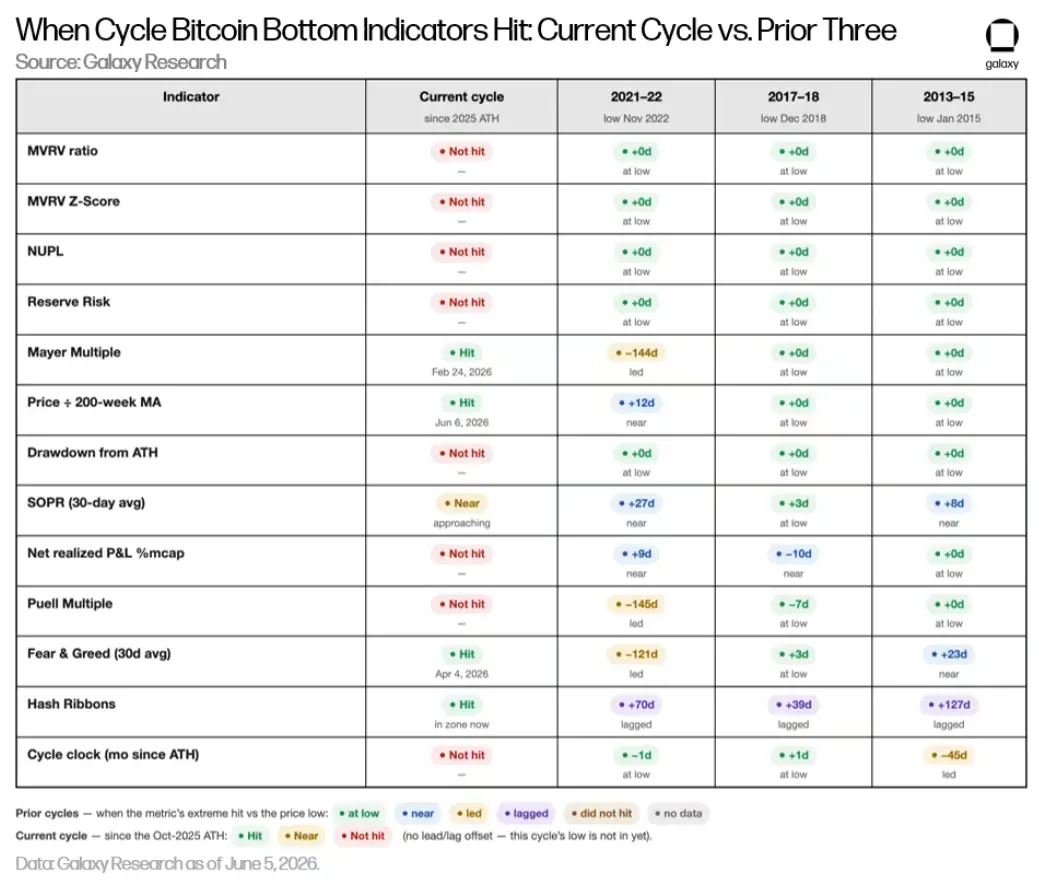
The numbers in the past cycle cells represent the days each indicator was closest to the extreme values of the bottom within a 180-day window, leading (-) or lagging (+) the cycle price low. Hash Ribbons indicate recovery crossover; cycle clock refers to the 12 months following the top.
Each indicator has been triggered at the last three bottoms, with significance lying in whether they signal early or late. The bottom of this cycle seems to have yet to arrive, thus the current column only displays whether each checkbox is marked since the price peak in October 2025.
Tops Are Getting Lower, Bottoms Are Getting Higher
Prior to drawing any conclusions, it is crucial to present a fact that underpins the remainder of the report: the volatility of Bitcoin has narrowed at both ends.
The frenzy at the top has been cooling down each cycle (MVRV sequentially being 5.91, 4.72, 2.93, and 2.29), while subsequent bottoms have risen each cycle, with MVRV increasing from 0.56 in 2015 to 0.69 in 2018, and to 0.75 in 2022.
In other words, the distance between the most overvalued and the most undervalued points in each cycle is continually shrinking. The price at the time of the crash tells the same story: declines of -85%, -84%, -77%, while this time currently only -51%.
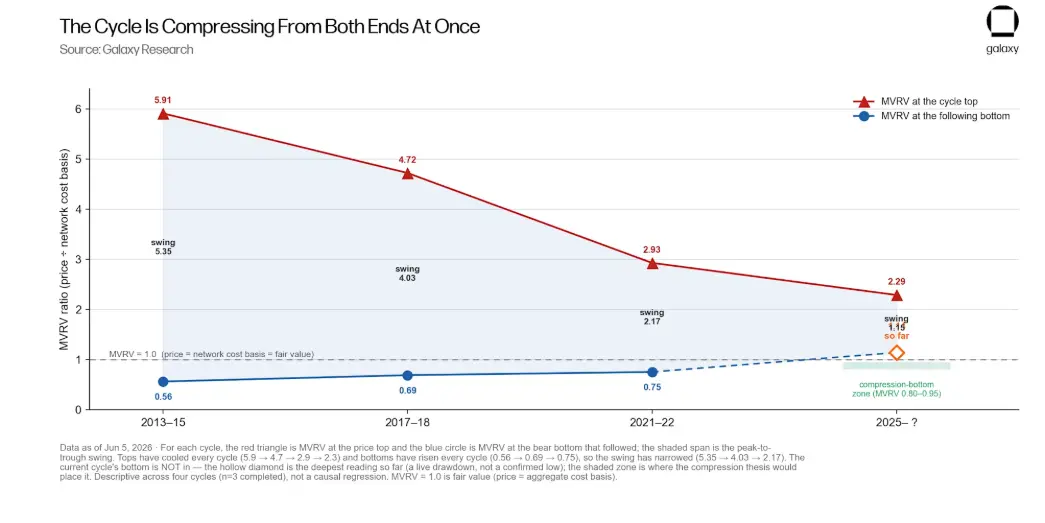
The ratio of each peak (red) and the subsequent bottom (blue) to the cost basis (MVRV) is converging toward "fair value" (1.0) from both directions. The data suggest that the current cycle likely has not yet bottomed out (the hollow diamond represents the deepest reading thus far). This describes the cycle pattern and does not guarantee where this cycle will bottom.
The cooling at the top and the rising bottom are descriptions of three completed cycles rather than natural laws. They do not in themselves prove that the next bottom will necessarily be shallow.
However, they allow us to pose an exact question and provide a precise answer: if a certain bottom behaves like past bottoms, to what extent is the dollar decline determined by the level of frenzy at the top?
Raising the Price Floor
MVRV is simply today's price divided by the on-chain cost basis. Conversely, the cost basis is the historical peak divided by the MVRV at the top. Thus, the lower the top MVRV, the closer the cost basis is to the peak.
Since the top in October was the calmest ever (with MVRV at 2.29), the cost basis ultimately landed at 43.7% of the historical peak (whereas the ratios for the tops in 2021, 2017, and 2013 were 34.2%, 21.2%, and 16.9%, respectively). A calm top does not pull down the lower bound; all else being equal, it gets closer to the peak, raising the lower bound.
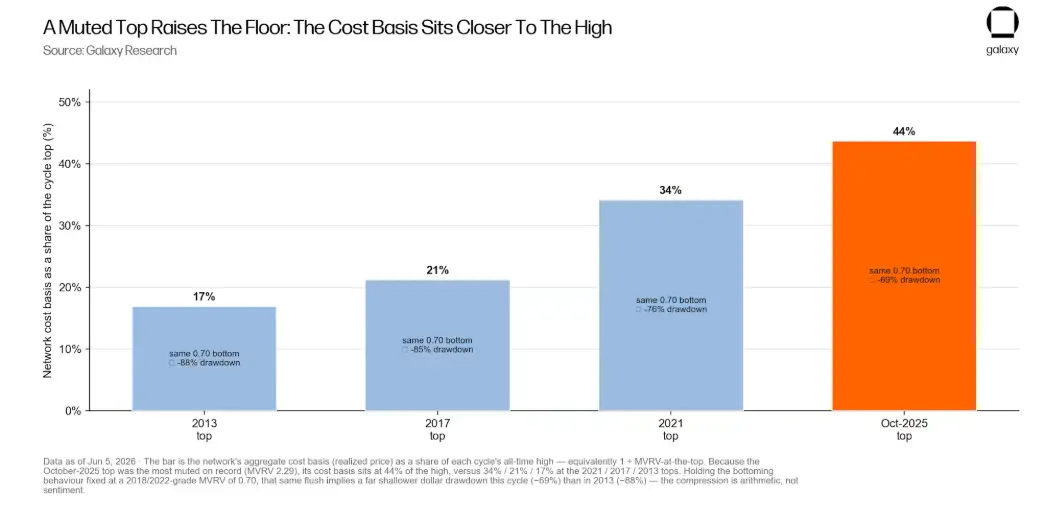
The proportion of the cost basis to the peak value of each cycle is rising, reaching 44% by 2025, precisely because each top has been more moderate. The notes on each column show how much a typical traditional bottom shape would correspond to the dollar decline of that cycle.
If we fix the performance of the bottom (assuming each cycle touches bottom at the same MVRV), it can be seen that each cycle's dollar decline is shrinking, purely because the starting point of the cost basis is higher. The table below illustrates this without any forecasts:
Each cell indicates: if the cycle bottoms at the MVRV in that column, the calculated decline based on that cycle's specific ratio of cost basis to peak.
The performance of the bottom in the same row is identical; only the calmness of the top varies. A typical traditional bottom (with an MVRV of 0.70) in 2013 meant a decline of -88%, but in this cycle, it is only -69%. This purely isolates the effect of the top, a matter of arithmetic, not an assertion that a calm top must lead to a higher bottom.
Where is This Bottom?
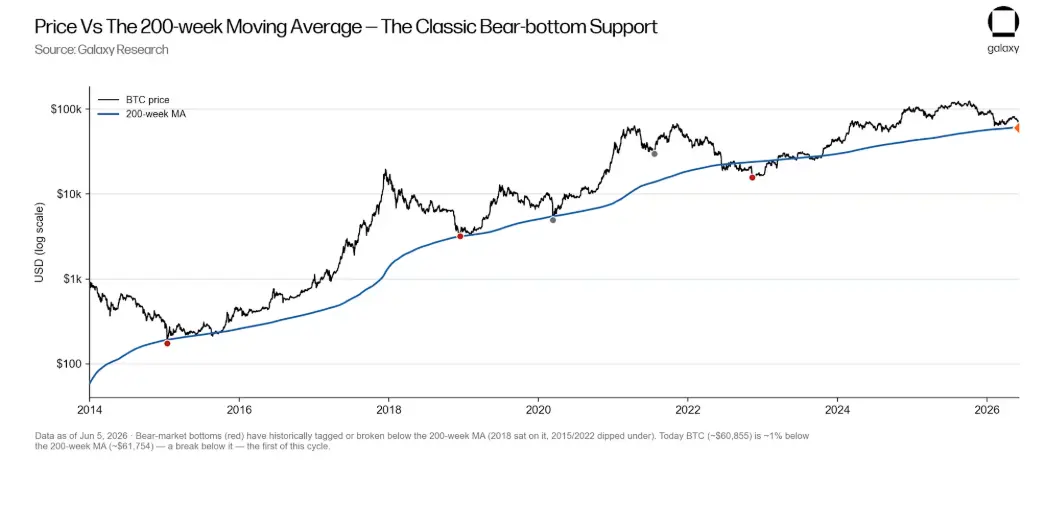
The bottom is not located by an integer percentage but relative to two key anchor points: the cost basis and the 200-week moving average (200w MA). The latter has served as long-term price support throughout Bitcoin's lifecycle.
Measured against these two anchors, the past three bear market bottoms clearly fell below both: averaging about -33% below the cost basis (with the deepest being -44% in 2015) and about -14% below the four-year average.
There are two points worth noting.
The first is that the gap below the cost basis is shrinking with each cycle (-44%, -31%, -25%), mirroring the contraction on the top side.
The second is that today's price has not touched that area at all. Even after a 51% drop, Bitcoin's price is still 14% above the cost basis (this cycle has never fallen below the cost basis) and only 1.5% lower than the four-year average. According to the scale that locates past bottoms, this bottom has yet to arrive.
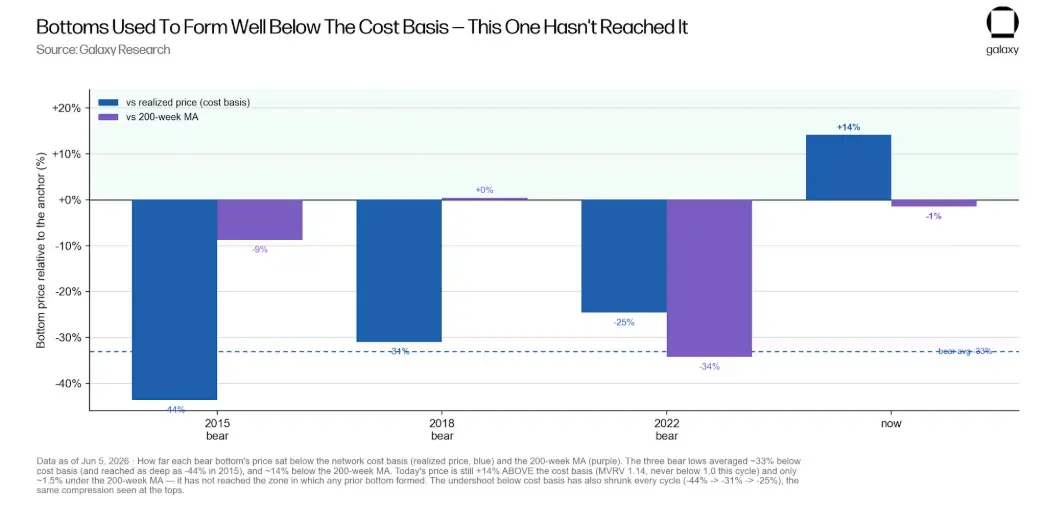
The distances to the past bear market bottoms below the cost basis (blue) and the four-year moving average (purple). The previous lows were all well below both; today's price remains above the cost basis and is slightly below the 200-week average, while the gap below the cost basis is shrinking with each cycle.
The conclusions drawn from the anchors and arithmetic align. Converting past gaps to today's anchor points points to the same area: a drop of -25% to -44% below the cost basis, roughly corresponding to $30,000 to $40,000; the gap to the four-year average spans about $41,000 to $62,000.
This indicates that the true bottom is likely lower than the current price but far higher than the previous levels of "75% to 85% declines."
Translating the arithmetic into price, based on the current $53,000 cost basis, yields not a single number, but a range of scenarios; let's first look at the one in the middle.
Our base scenario, assuming the bottom merely continues the trend toward fair value (with MVRV between 0.75 to 0.86), roughly lands between $40,000 and $46,000. If a stricter, deeper washout similar to 2018 or 2022 occurs (with MVRV between 0.56 to 0.70), the price would drop to $30,000 to $37,000.
If it is a shallower outcome, meaning stable buying around the cost basis absorbs the declines (with MVRV between 0.95 to 1.01), the price would be around $51,000 to $54,000; and merely touching the rising four-year average (at $62,000) would mean only about a -51% decline. (For illustration only. Actual results may vary materially.)
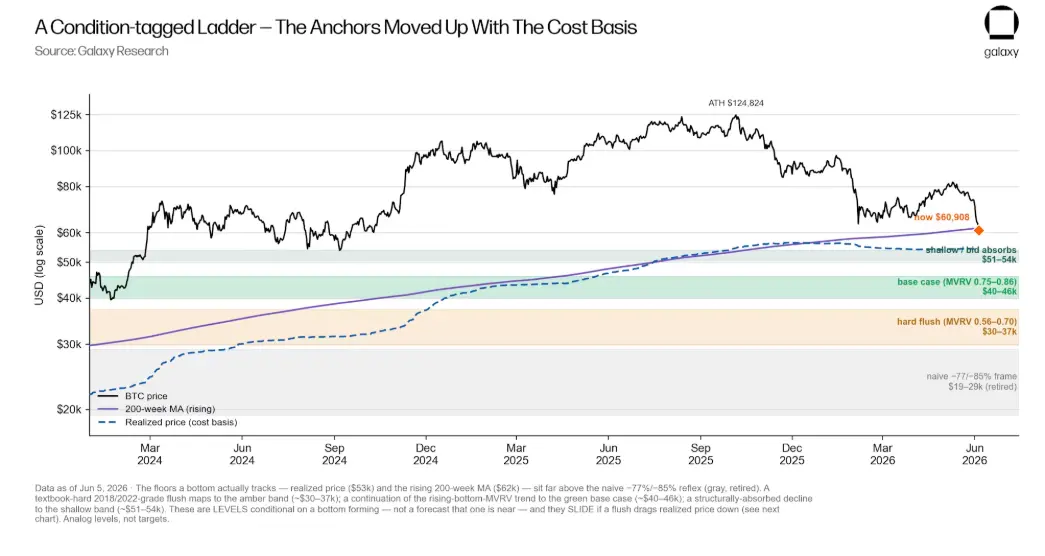
Several scenarios drawn by price. The cost basis and the continually rising four-year moving average (historical evidence shows that bottoms tend to follow these two lines) are far above the old "75% to 85% drops" range (gray, now discarded).
The colored bands transform past bottom patterns into today's dollar levels. These levels assume that "a bottom has formed," and are not predictions of an imminent bottom. For illustration only, actual results may vary materially.
The real highlight is how all of this disrupts old empirical rules. A -77% to -85% decline (the precise metrics from past cycles) would place this bottom at $19,000 to $29,000.
However, this rule actually double counts the influence of a calm top: the past extreme declines of 75% to 85% were established atop extremely frenzied peaks; while this cycle's peak is already moderate and close to the cost basis. Imposing a deep drop proportion aimed at extreme frenzy onto this moderate peak inevitably distorts the bottom prediction.
In this entire picture, the cost basis is like a tide surging below, most clearly indicating that the "lower bound" is subject to movement.
Over the past year, as high-priced buyers in this cycle continually raised the average price, the cost basis has climbed from about $47,000 to nearly $56,000 by the end of 2025 (a 20% increase). This rise is the deepest reason why the current bottom is far above the old rules.
However, as some chips from 2024 to 2025 incur losses during the decline, the realized price has subsequently fallen about 5%, to around $53,000.
Entering the end of 2026, the realized price (i.e., cost basis) will become a key variable determining the bottom: a calm, orderly decline can stabilize it, keeping the base scenario at around $45,000; while true panic can push it further down, dragging overall predictions downwards.
Why Is the Bottom Also Movable?
The cost basis has a reflexive quality. It appears to be a bottom line, but it is built up by the prices of the last transactions of chips. In a true sell-off, chips changing hands at a loss will pull down this average value, so this "floor" not only fails to support the price, but will instead follow the price downward.
This poses the greatest limitation to the argument of raising the lower bound. The buffer space is thin: today's price is only about 14% above the cost basis (MVRV is 1.14), while this cycle has never fallen below it.
If a round of sell-offs pulls the cost basis down by 10%, 20%, or 30%, a typical bottom pattern could drop from about $40,000 to around $36,000, $32,000, or $28,000, re-entering the normal historical range.
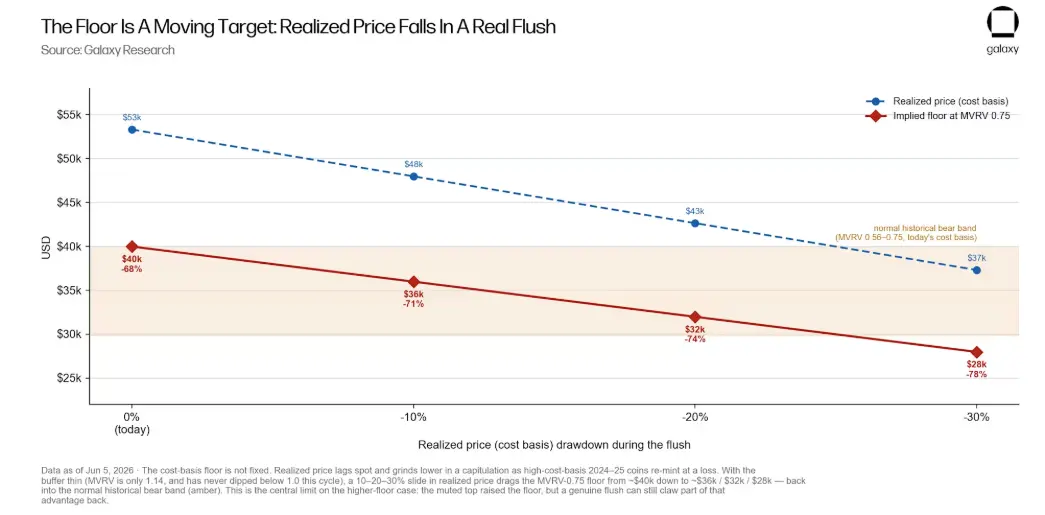
Maintaining the bottom pattern while allowing the cost basis to drop during a sell-off. The implied bottom price would slide back from around $40,000 to about $28,000, re-entering the normal historical range (amber). The calm top raised the lower bound, while true panic would erase some of that increase.
The stability provided by spot ETFs and corporate treasuries, along with price-insensitive buying, is something previous cycles did not have; it tends to elevate a higher lower bound. But it can equally buffer declines and amplify them.
The nature of the source of this kind of capital dictates that digital asset treasury companies (DAT) and corporate treasuries typically buy on the way up rather than catching falling knives; and ETF funds have recently seen net outflows in 2026. Should a real deep sell-off occur, fund redemptions may be forced to sell, rather than absorb sell orders.
In the 2022 cycle, we witnessed the largest forced sell-off in crypto history, and it only declined by -77%. So the assertion that "this time the leverage is lower" may not hold up. (These are merely supporting arguments and not the core pillars of the argument.)
A higher lower bound and the risk of it being eroded in a panic are two sides of the same mechanism: this cycle's cost basis starts higher, but should true market capitulation occur, it will also decline. This is precisely why we value ranges over singular values.
Data Indicates the Course of Pullbacks
Our analytical conclusion clearly points to how deep the pullback will fall and how long it will take.
A more moderate top has raised the cost basis to 43.7% of the historical peak, thus for any established bottom pattern, the dollar decline is mechanically milder than in any past cycle.
We believe that the empirical rule stating, "Bitcoin has always dropped 75% to 85%, so this cycle will bottom at $19,000 to $29,000" has become outdated as a literal price bottom.
Even if a deep washout similar to the past occurs, it corresponds to a much higher number now. Therefore, even our set harsher washout is above that range, while our base scenario falls toward the middle of $40,000.
Cross-referencing past cycle indicators and timing data, it is likely that the bottom has not yet appeared. Only 4 of the 13 bottom indicators have lit up, while the current pullback is only about 8 months long, and historical patterns indicate bottoms within 12 to 13 months (and the cost basis itself will also decline).
There are several true signals of deep washout: price falling below the cost basis, overall holders being in losses, continuous selling at losses, effectively breaking below the four-year average, and experiencing bear market-level deep drops. If these signals begin to reverse at levels far above the old range, it suggests that the contraction of amplitude at both ends of the cycle is real.
Conversely, if a comprehensive capitulation-style sell-off occurs on schedule, then the calm top has merely delayed the pain without lightening it. In either case, the arithmetic of the cost basis indicates that the starting line for this judgment is far above the levels assumed by the old four-year cycle rules.
This is a descriptive study discussing how a calm cycle top shapes the arithmetic logic of cycle bottoms and does not necessarily predict price direction or price targets. The price levels we have set are based on historical data compared to the current pullback relative to today’s cost basis (which will also fluctuate).
Appendix A: Chart Library
We have compiled a wealth of auxiliary charts categorized by theme. The first group builds the framework of cycles; the second group meticulously lays out a complete bottom checklist. In each indicator chart, the shaded area shows the range achieved by that indicator at the lows in 2015, 2018, and 2022, with the orange mark indicating the latest reading.
Cycle Diagram
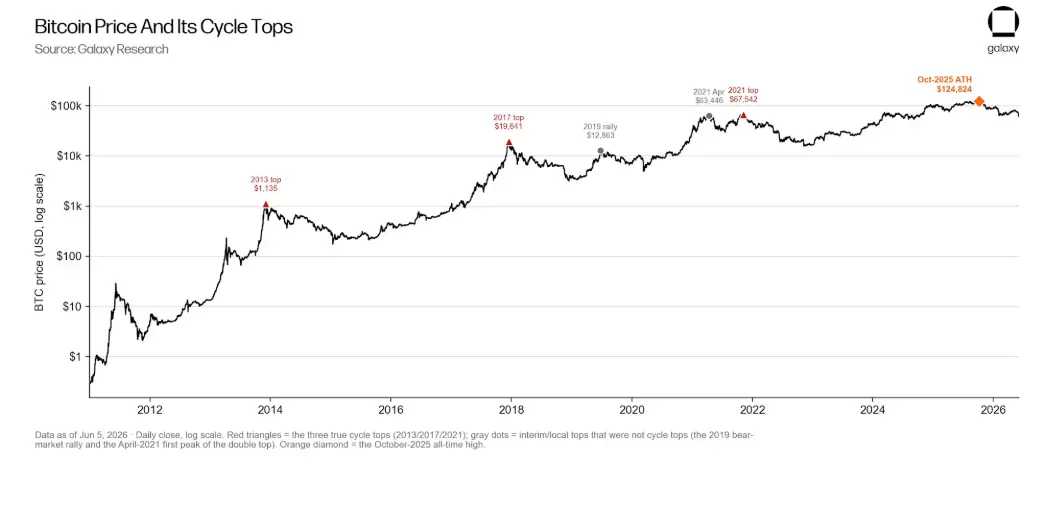
Price and its Cycle Tops. The complete price history of Bitcoin on a logarithmic scale, marking the tops of the past three cycles (red) and the peak in October 2025 (orange).
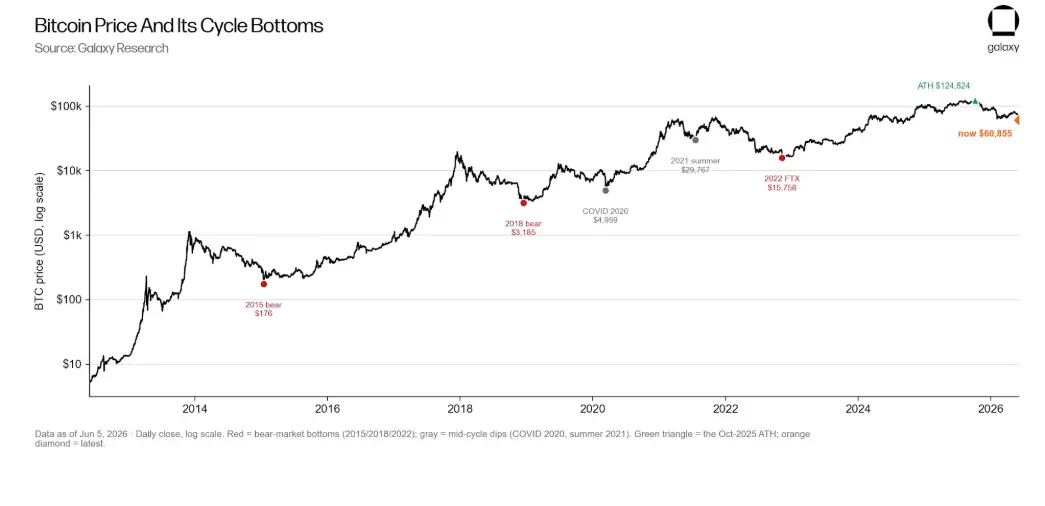
Price and its Cycle Bottoms. The same historical segment, marking reference lows: the bear market bottoms of 2015, 2018, and 2022 (red), as well as the Corona crash and the mid-2021 pullback (gray).
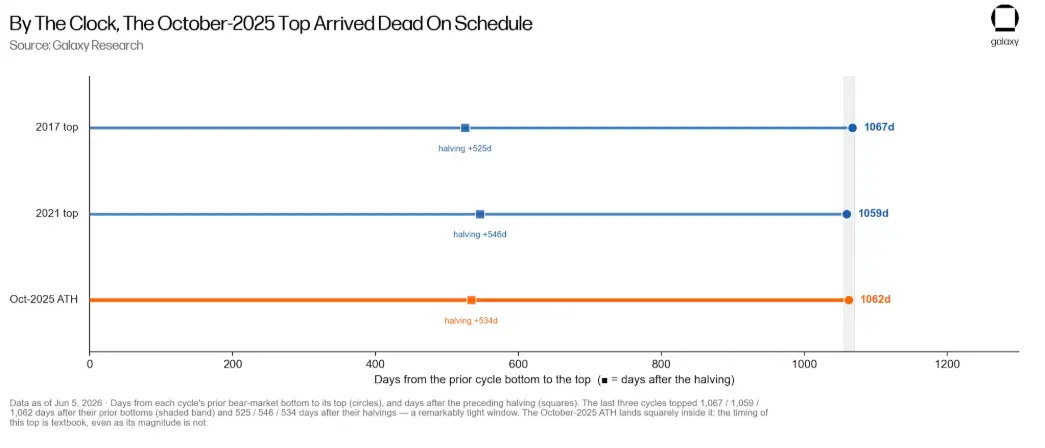
Cycle Clock. The number of days until each top arrives after the previous low (circle) and halving (square). The peak in October 2025 lands precisely within the historical window.
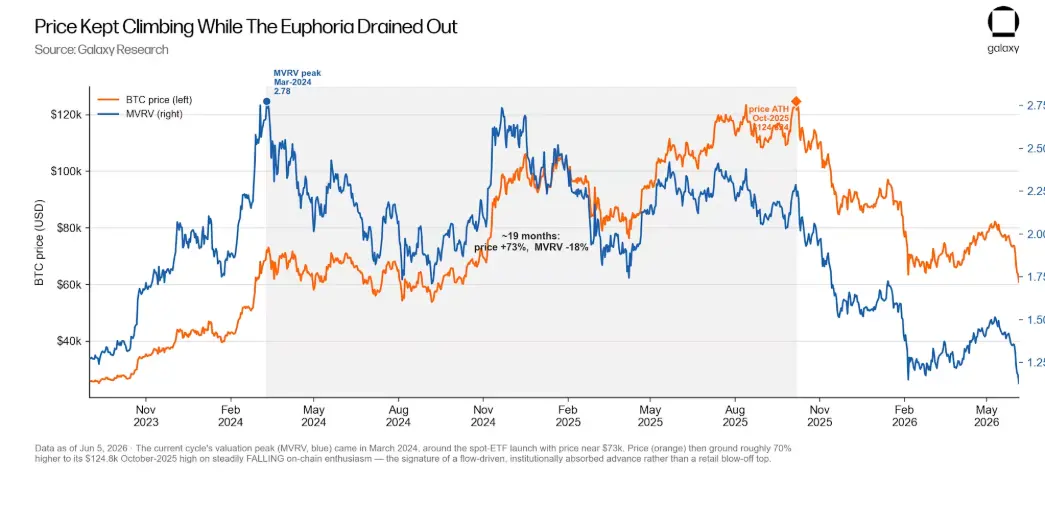
Frenzy Arrives Early. The peak of the cycle valuation occurred in early 2024, around the time the spot ETF was introduced; subsequently, on-chain enthusiasm faded while the price rose by about 70% until the peak in October 2025.
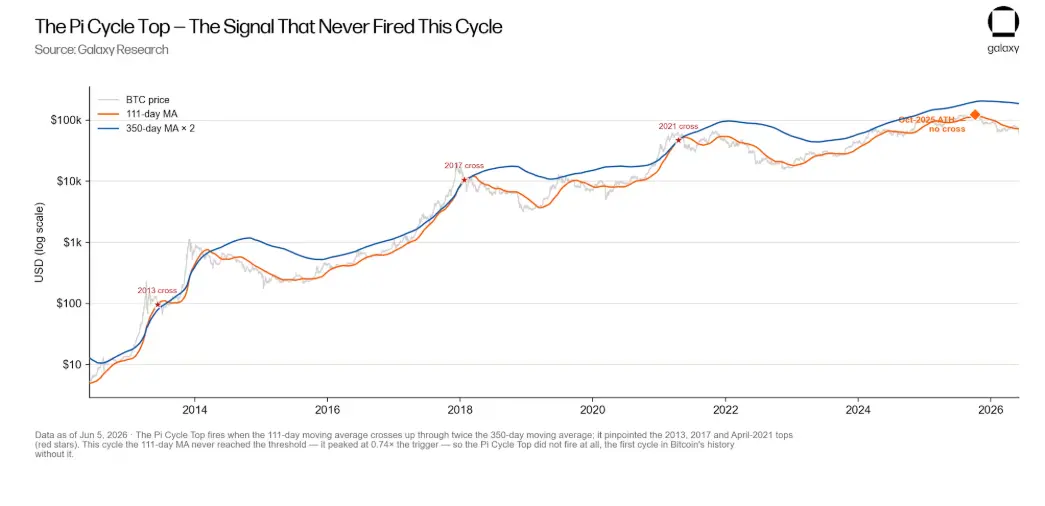
That Untriggered Signal. The Pi Cycle Top has accurately predicted the peaks of 2013, 2017, and 2021 within days (asterisk). Yet in this cycle, the triggering conditions have never been met (the first time this has happened at any cycle top).
Bottom Indicator Analysis
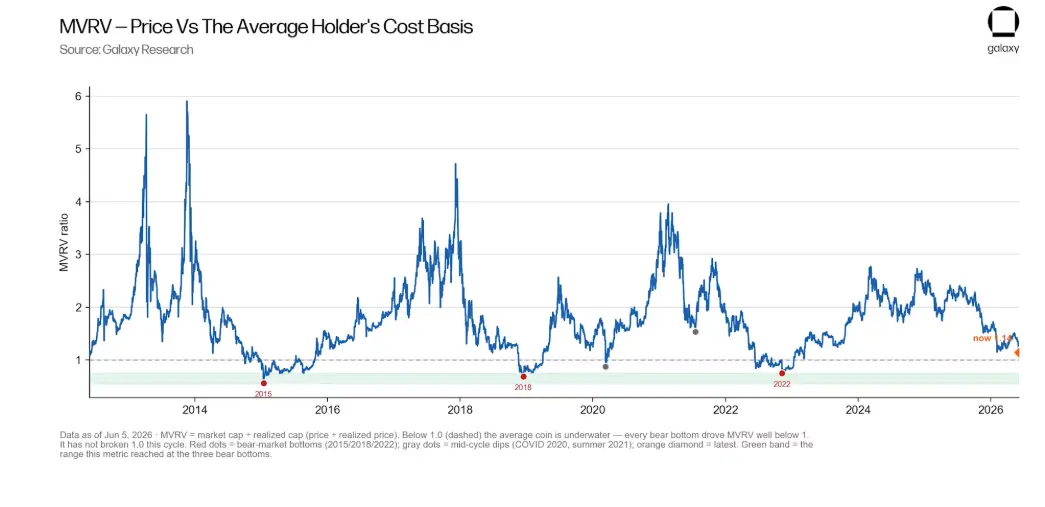
MVRV. The ratio of price to the average cost basis borne by holders. Past bottoms pushed it well below 1.0; this cycle's lowest point has stopped at 1.14.
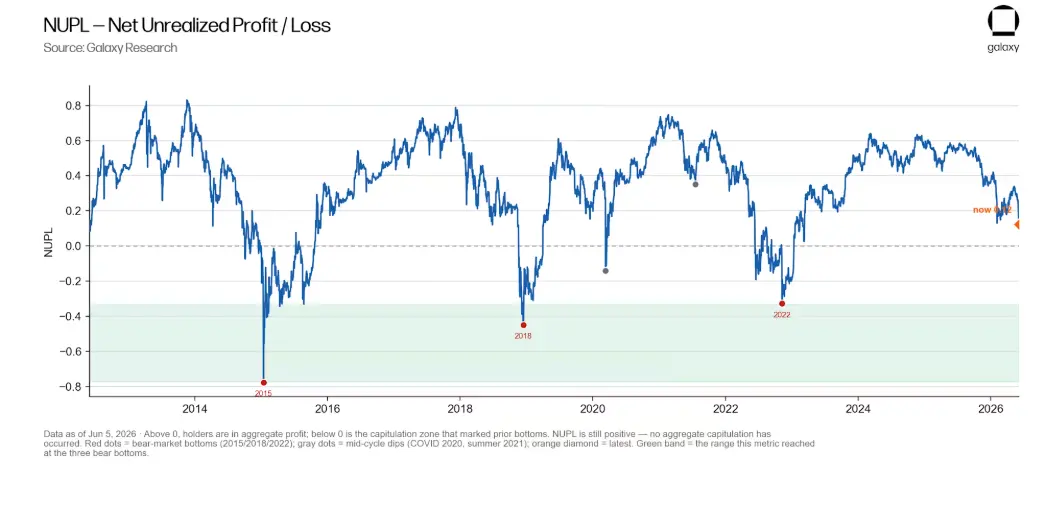
NUPL. The percentage of market capitalization in unrealized profits. Past bottoms drove it below zero (overall losses); today it remains positive.
MVRV Z-Score. A standardized version of MVRV. Past bottoms recorded deep negative values; this cycle it remains positive.
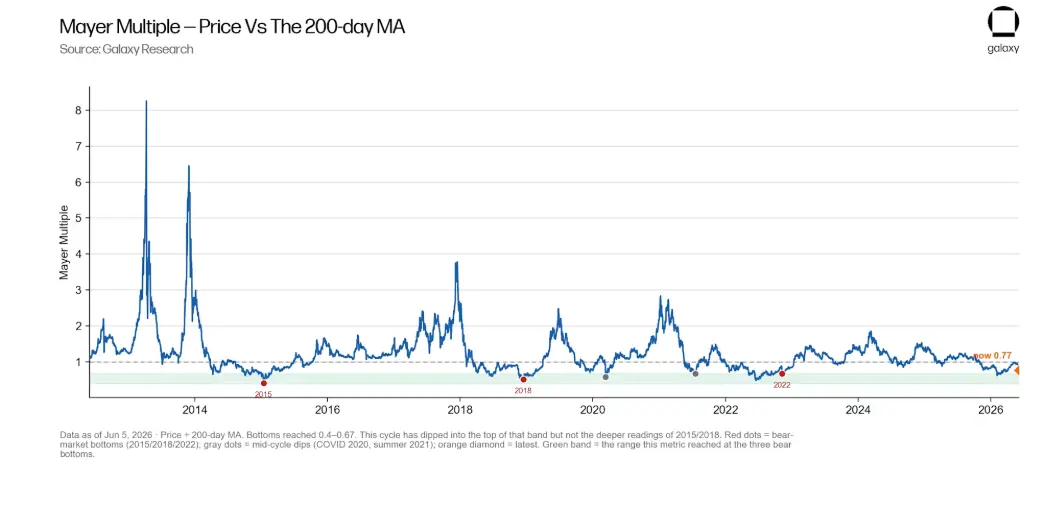
Mayer Multiple. Price divided by the 200-day moving average. It has delved into the bottom range, being one of the most bottom-characteristic trend signals.

Price Compared to the Four-Year Moving Average. The 200-week moving average is Bitcoin's most persistent support. Past bottoms have touched or fallen below it; today, the price has dipped below it for the first time in this cycle.
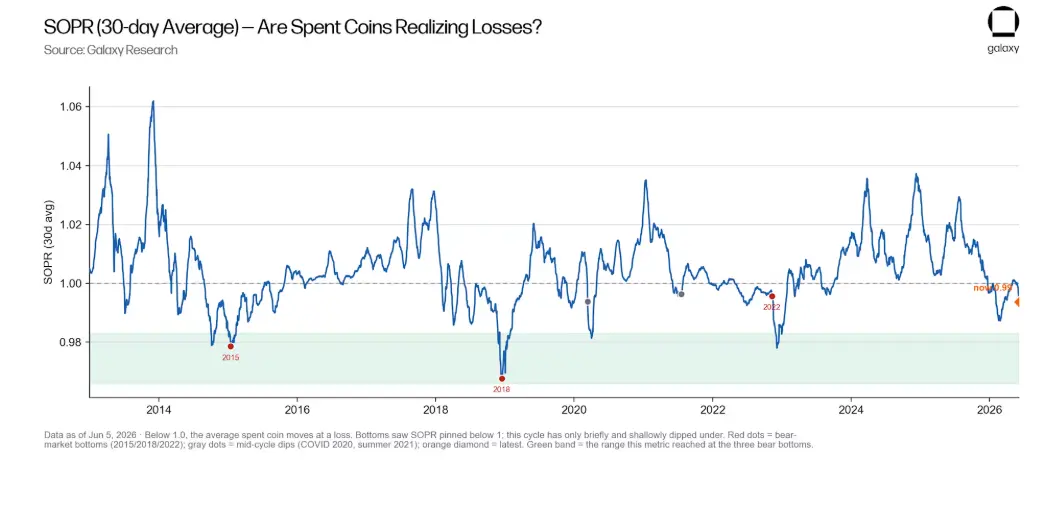
SOPR. The average profit and loss of the chips that were transferred on that day. Past bottoms have kept it below 1.0 for several months (indicating sell-off); this cycle it has only slightly brushed below it.
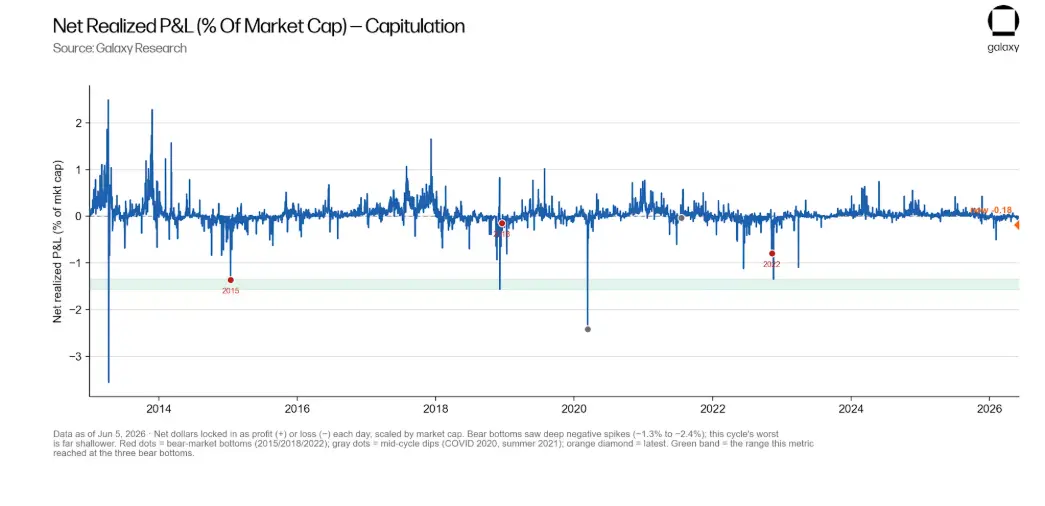
Net Realized Profit and Loss. The daily amount of profit (+) or loss (-) locked in, scaled by market size. The surge of extreme loss leading to a bottom has yet to appear.
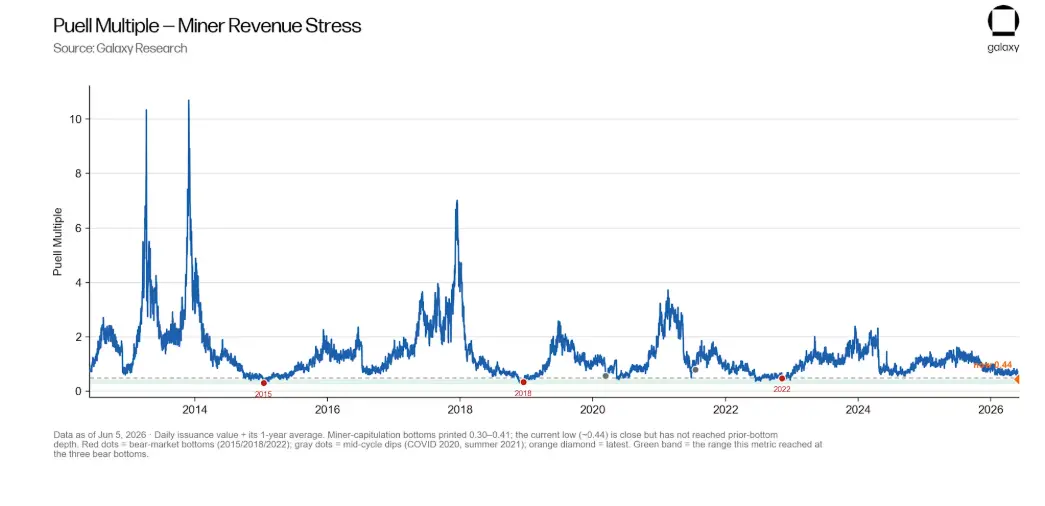
Puell Multiple. A miner income pressure indicator. The recorded readings of miner capitulation bottoms have been between 0.30 to 0.41; this cycle's low (around 0.44) is close but hasn't touched.
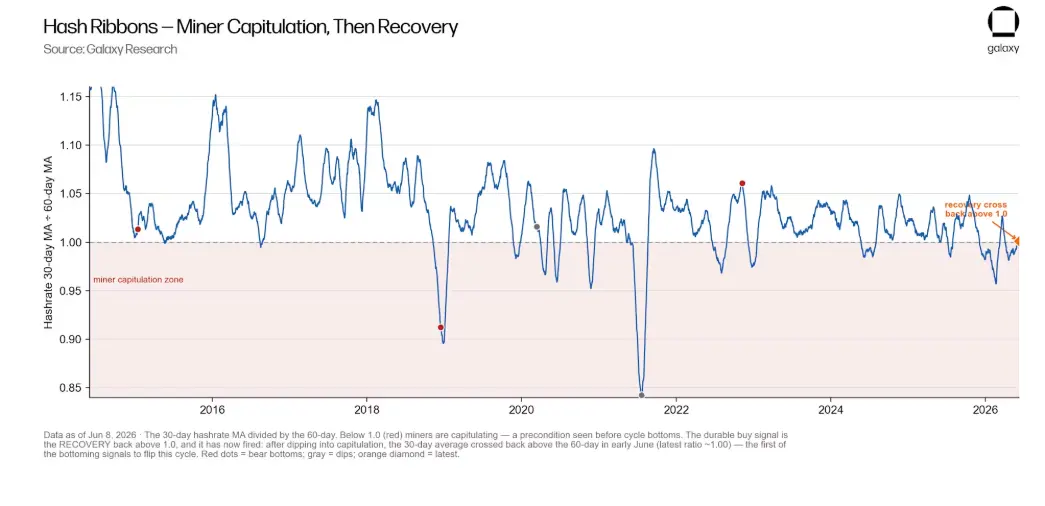
Hash Ribbons. Mining power momentum. Falling below 1.0 means miners are capitulating; in 2026 it has persistently dipped below this threshold.
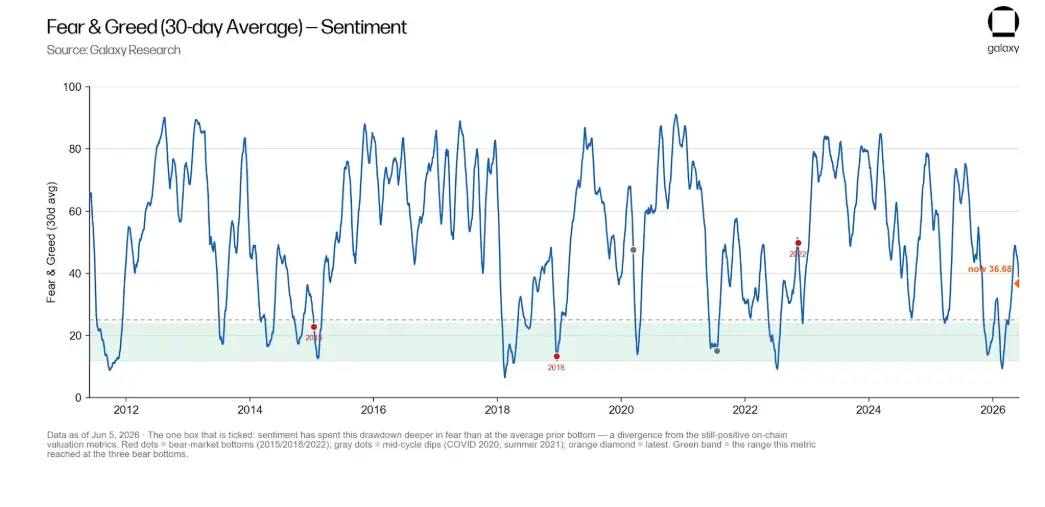
Fear and Greed Index. Our proprietary emotion index on a scale of 0 to 100, which has fallen into fear during this decline to a greater extent than the average levels seen at past bottoms. This is the only indicator that has definitively triggered.
Appendix B: Glossary
Bitcoin Cycle. The rhythm of about every four years for Bitcoin, including several years of rising to historical highs, sharp declines to lows, and a long recovery. Each cycle typically revolves around halving.
Halving. Approximately every four years, the output rate of new Bitcoin is cut in half. This is a fixed feature of the protocol and has historically served as an anchor for each cycle.
All-Time High (ATH). The highest daily closing price of Bitcoin in history. The all-time high for this cycle is $124,824 on October 6, 2025.
Drawdown. The extent of a price drop from peak to trough, expressed as a percentage. A -50% drawdown means the price has fallen by half from its historical high.
Cost Basis, also known as Realized Price. An estimate of the average price the market has paid for the Bitcoin held. Technically, it sums the price of each Bitcoin at the time of its last chain transfer and divides it by the number of bitcoins. It is the single most critical anchor point in this report, which we also call the network’s cost basis.
Market Capitalization. The total dollar value of all Bitcoins calculated at the current price (price × circulating supply of Bitcoin).
Realized Market Capitalization. The total value of all Bitcoins calculated at the price at the time of their last move, rather than the current price. The realized price is the realized capitalization divided by the number of Bitcoins.
MVRV Ratio. Market capitalization divided by realized capitalization, which is also equal to the daily price divided by the network's cost basis. Above 1.0, the average Bitcoin is in profit; below 1.0, the average Bitcoin is in loss. This is the core thread running through this report.
MVRV Z-Score. A standardized version of the difference between market capitalization and realized capitalization, allowing for comparison of extreme highs and lows in Bitcoin across vastly different price eras.
NUPL (Net Unrealized Profit and Loss). The ratio of unrealized profits to total market capitalization. High positive values indicate greed near the top; below zero (overall paper losses) often accompanies a desperate sell-off near the bottom.
SOPR (Spent Output Profit Ratio). The average profit and loss of chips that are transferred on that day. Above 1.0 indicates profit-selling; suppressed below 1.0 shows holders selling at a loss (a bottom signal).
Mayer Multiple. Price divided by the 200-day moving average. A simple indicator used to measure how far prices deviate from mid-term trends.
200-Day/200-Week Moving Average. The average closing price over the past 200 days (mid-term trend) or 200 weeks (about four years, the longest-term support line for Bitcoin).
Puell Multiple. The dollar value of new Bitcoin mined to its one-year average, used to gauge miner income pressure (low) or breakout potential (high). This metric is named after ARK Invest analyst David Puell.
Reserve Risk. A measure of long-term holders' confidence relative to price. It is presented in ratio form and used only in relative terms in this report.
Pi Cycle Top. A timing indicator triggered when the 111-day moving average crosses above twice the 350-day moving average. It has accurately predicted the tops of 2013, 2017, and 2021 within days; this cycle has never triggered.
Hash Ribbons. A comparison of the 30-day and 60-day average hash rate. When the short-term moving average falls below the long-term moving average, the most costly miners start shutting down (capitulation); recovery crossovers historically always appear ahead of bottoms.
Fear and Greed Index. A 0 to 100 emotion index built from on-chain, derivatives, and funding flow data. Low readings indicate extreme fear (near bottoms), while high readings indicate extreme greed (near tops).
RSI (Relative Strength Index). A momentum oscillator ranging from 0 to 100; high readings indicate an overbought market, typically occurring near tops.
Cycle Clock. The number of days that have elapsed since the starting low of the cycle or from halving to the top or bottom. The past three peaks of Bitcoin have occurred about 1,060 days after the previous low; bottoms have appeared approximately 12 to 13 months after the peak.
Reflexivity. This concept, popularized by George Soros in his 1987 book "The Alchemy of Finance," refers to the notion that the standard used as a measure can itself be influenced by price fluctuations. Here, the cost basis appears to be a bottom line, but during true sell-offs, the chips changing hands at a loss will drive this figure down. The lower bound is a moving target, not a fixed red line.
免责声明:本文章仅代表作者个人观点,不代表本平台的立场和观点。本文章仅供信息分享,不构成对任何人的任何投资建议。用户与作者之间的任何争议,与本平台无关。如网页中刊载的文章或图片涉及侵权,请提供相关的权利证明和身份证明发送邮件到support@aicoin.com,本平台相关工作人员将会进行核查。


