Tokenized stocks have passed the proof of concept stage, but are still far from an independent market.
Written by: Bitget Wallet Research Institute
Introduction
To what extent have tokenized stocks progressed? Ultimately, it comes down to data, not just narrative.
Ondo Global Markets is currently the largest tokenized stock platform in the world and the first platform to surpass a TVL of one billion dollars. As of May 2026, the platform has processed a total trading volume of five billion dollars, covering 2.8 million transactions and over 180,000 independent wallets. Looking at these figures, one basic judgment can be made: tokenized stocks are no longer a "proof of concept", but a market that is truly operational.
But what does this market actually look like? Who is using it? How do they use it? What is its relationship with traditional stock markets? Bitget Wallet, based on on-chain data from Ondo Global Markets, attempts to outline a relatively complete picture.
About the data: The data in this report comes from the trading analysis dashboard of Ondo Global Markets on Dune, covering the Ethereum and BNB Chain networks, with a timestamp of May 12, 2026. Activities on Solana and HyperEVM are not included due to the lack of decoder tables provided by Dune at the analysis point.
Key Judgments
- On-chain can run 24/7, but people still follow Wall Street’s clock.99% of transaction volume occurs from Monday to Friday, with more than half taking place during U.S. trading hours; weekend transaction volume accounts for only 0.55%. Currently, tokenized stocks resemble a "delayed access channel" for U.S. stocks, rather than an independent 24/7 market.
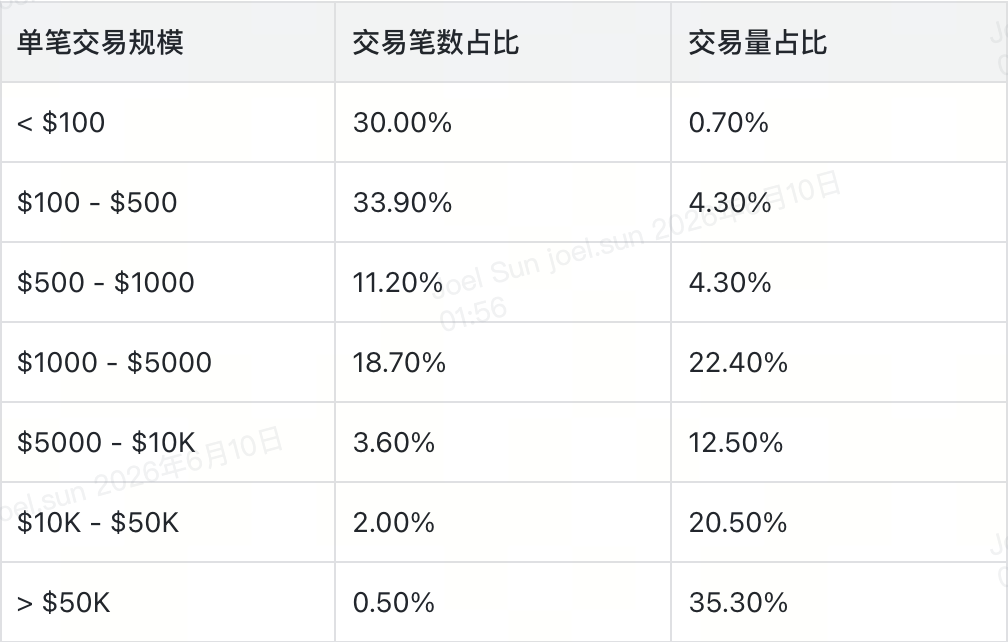
- Retail investors are indeed participating, but pricing power is not in their hands.Orders below 500 dollars contribute to nearly 64% of transaction numbers but account for only 5% of transaction volume. On the other hand, orders above 50,000 dollars, although only 0.5% of the number, account for 35.3% of transaction volume. The market's popularity relies on retail investors, while its depth relies on large funds; this structure is no different from traditional financial markets.
- AI is the first sector theme to be genuinely priced on-chain.AI-related tokenized stocks account for approximately 35%-40% of recent transaction volume. NVDAon has the strongest liquidity without a doubt, but more interestingly, Micron, Qualcomm, and Snowflake—these supply chain and infrastructure targets—show stronger net inflow signals than Nvidia. Users are not betting on one AI leader, but are accumulating along the entire AI industry chain.
- Beyond tech stocks, there is emerging demand for the access of ETFs and commodities.Common stocks still dominate (72.5% of transaction volume), but the user reach of silver ETFs and gold ETFs is comparable to tech stocks. SLVon is the asset with the most wallets on the BNB Chain (almost 20,000), indicating that many users are looking for hard asset exposure rather than high odds—something not necessarily available through local brokerage systems.
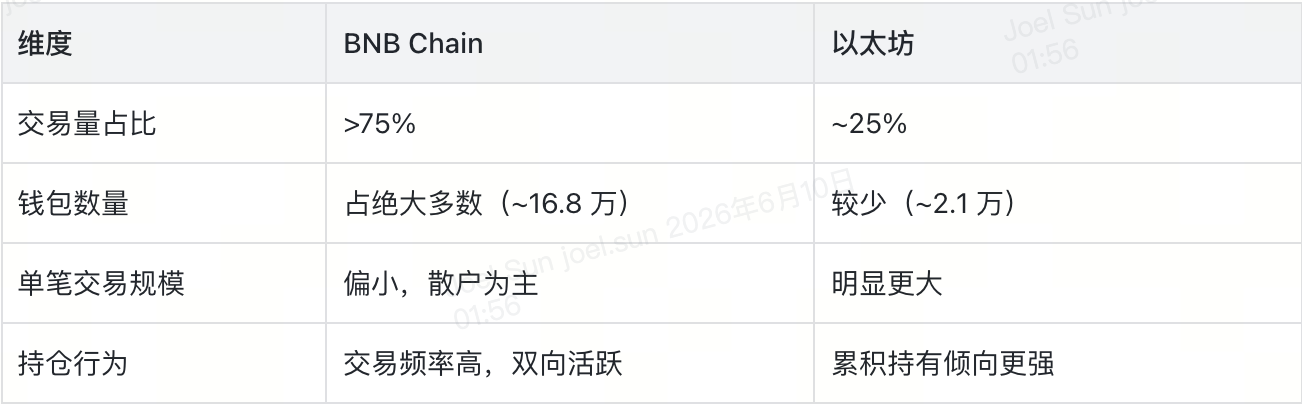
- Ethereum and BNB Chain are two completely different markets.BNB Chain contributes 75.6% of transaction volume and around 168,000 wallets, serving as the main battleground for popularity and trading volume; Ethereum's average transaction amount and per capita transaction volume are more than 2.5 times higher, resembling the "holding layer" for high-net-worth users. The behavior of the same tokenized stock on the two chains can be completely opposite.
A 5 Billion Dollar On-Chain U.S. Stock Market
The earliest landing scenario for RWA was institutional infrastructure—tokenized government bonds, money market funds, collateral management, and clearing and settlement optimization. Tokenized stocks are different, as they target retail users: stocks and ETFs are among the most familiar financial assets for global users, tightly bound to market trends, information, and social discussions.
Data from RWA.xyz shows that the market capitalization for on-chain distributed tokenized stocks has exceeded 1.4 billion dollars, with monthly transfer volumes approaching 3 billion dollars and nearly 100,000 monthly active addresses, with over 250,000 holders. In the context of traditional stock markets, this scale is certainly small; but on-chain, it is sufficient to support a very granular analysis of user behavior.
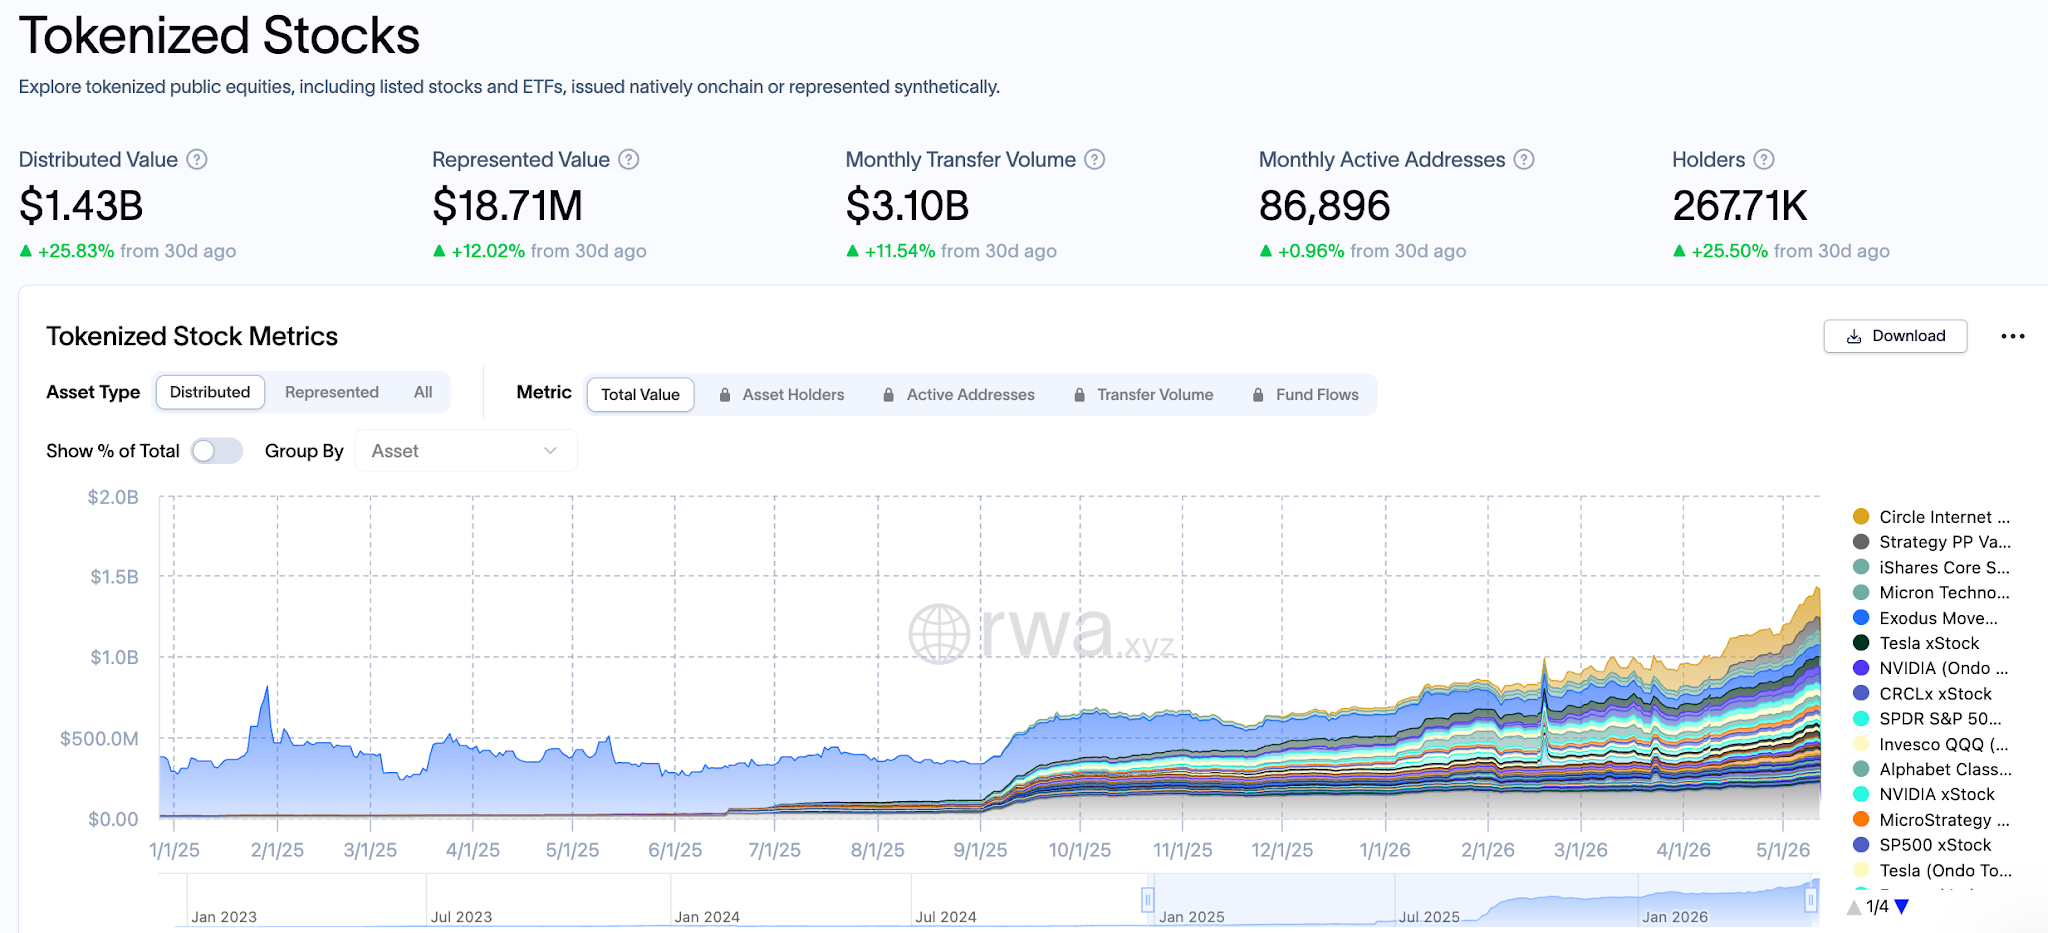
Image source:RWA.xyz
Ondo Global Markets is the ideal data sample for observing this trend. The platform went live on Ethereum in July 2025 and subsequently expanded to the BNB Chain, offering tokenized exposure underpinned by real U.S. securities (custodied by U.S. registered brokers), supporting 24/7 permissionless trading and 24/5 instant minting and redemption through smart contracts.
The following data covers all activities on Ethereum and the BNB Chain up to May 12, 2026:
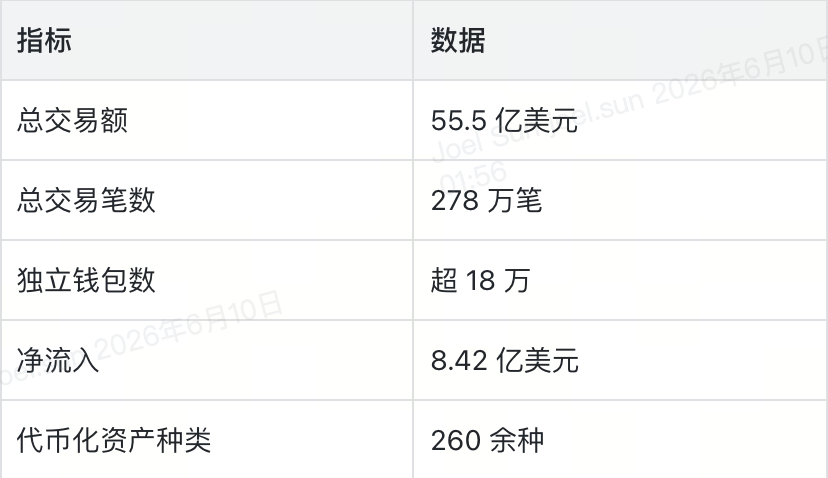
Data source:Ondo Global Markets — Trading Analytics, Dune
Overall activity fluctuates significantly but the trend is upward. In March 2026, the monthly transaction volume reached a historical peak of 1.38 billion dollars; in the first 12 days of May, it already ran to 430 million dollars. During the same period, the platform's TVL surpassed 1 billion dollars.
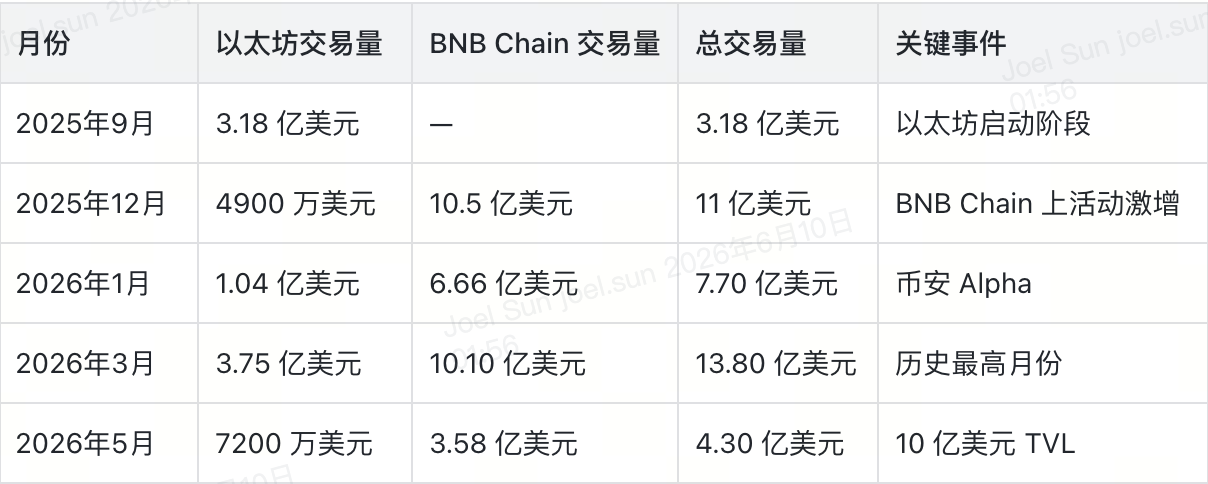
Data source:Ondo Global Markets — Trading Analytics, Dune
Running On-Chain 24 Hours, Trading Still Follows Wall Street
One of the most appealing narratives surrounding tokenized stocks is breaking the boundaries of trading time. When traditional exchanges close, on-chain trading can still mint, redeem, and transfer.
Theoretically true, but not in reality.
The distribution of trading times is clear: approximately 52% of transaction volume occurs during U.S. market hours and overnight sessions, with pre-market and after-hours totaling about 28%, and exclusive Asian and European periods adding up to around 20%. Weekend trading can nearly be ignored—accounting for 0.55% of transaction volume and 0.39% of transaction numbers.
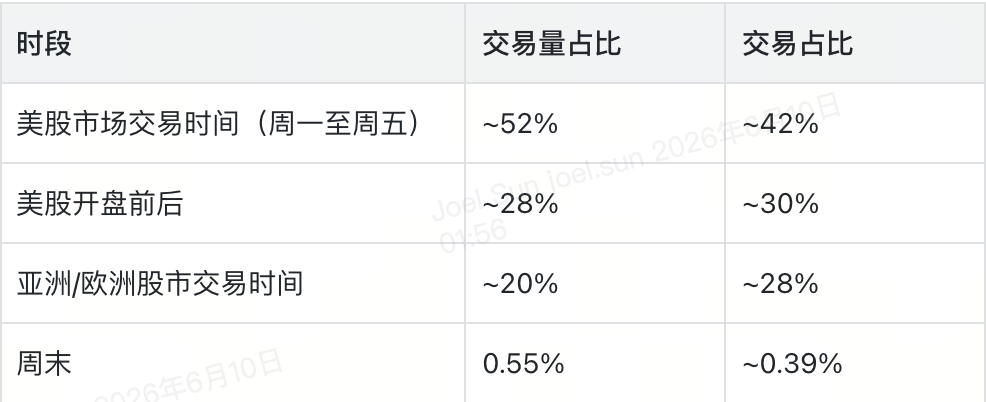
Data source:Ondo Global Markets — Trading Analytics, Dune
More specifically, trading peaks occur from 10 AM to 12 PM Eastern Time, Monday to Friday, with transaction volume during this window being 4 to 5 times that of non-trading hours. This indicates that users can indeed trade at any time, but they prefer not to. Their behavior is still driven by U.S. market liquidity, news, price discovery, and market sentiment.
The true role of tokenized stocks at this stage is as a “delayed access layer for U.S. stocks oriented towards global users.” For those outside the traditional brokerage system's coverage, this access has its value. However, evolving from "delayed access" to an "independent market" requires three conditions: thicker liquidity during non-trading hours, more reliable price discovery during non-U.S. hours, and real user participation active during those non-U.S. hours.
Retail Investors are Flowing In, but Pricing Power Remains with the Whales
Is there genuine retail participation in tokenized stocks? Yes. But is transaction volume dominated by retail investors? Not at all. This structure is not surprising, as most financial markets operate this way. However, breaking down the data can help us understand the current real stage of this market.
Let's start with the small orders. Orders below 100 dollars account for 30% of transaction numbers, while orders from 100 to 500 dollars account for 33.9%. Combined, orders below 500 dollars comprise nearly 64% of total transaction numbers, but contribute only 5% of transaction volume.
Now, let's look at the larger orders. Orders above 50,000 dollars only make up 0.5% of the number of orders but contribute to 35.3% of transaction volume; orders in the 10,000 to 50,000 dollar range contribute 20.5% more. In other words, less than 1% of orders account for over a third of the transaction volume.
Data source:Ondo Global Markets — Trading Analytics, Dune
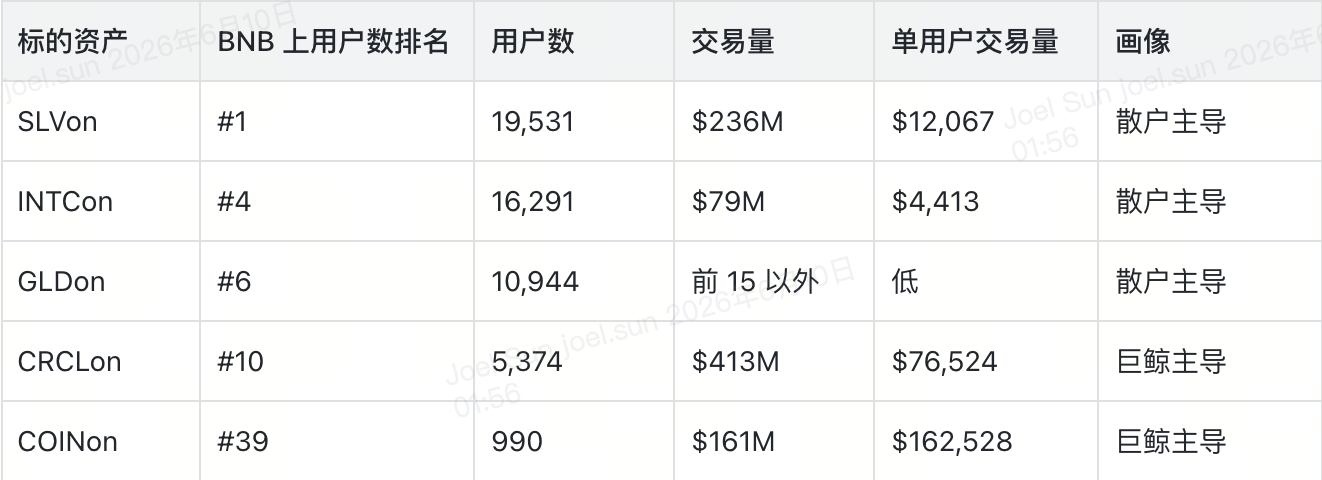
Diving into specific assets, the differentiation becomes more evident. The tokenized silver ETF (SLVon) is the asset with the most wallets on the BNB Chain, having 19,531 users and 236 million dollars in transaction volume; GLDon, INTCon are similar, with quick user growth but lower average amounts. Conversely, CRCLon, COINon exhibit significantly higher per capita transaction volumes—with fewer users but thicker funds; they are typical "whale-type" targets.
The coexistence of these two types of assets forms a dual structure: tokenized stocks allow those who previously couldn't buy U.S. stocks to do so, while also serving those who already have capital but are merely trading in a different venue.
Data source:Ondo Global Markets — Trading Analytics, Dune
Ondo Global Markets directly incorporates liquidity from the Nasdaq and NYSE's 24/5 periods, maintaining depth and minimal slippage across different trading scales, something traditional DEXs cannot achieve. However, further improvement in market quality depends on whether liquidity can continue to deepen. "Retail distribution" and "institutional-level liquidity" are two legs; without one, this market cannot stand firm.
AI Concept Stocks Stand Out, Gold and Silver Quietly Emerge
AI Sector: Contributing Nearly Four-Tenths of Trading Volume
What is the biggest theme in U.S. stocks from 2025 to 2026? AI. This is now directly reflected on-chain.
On Ondo Global Markets, AI-related tokenized stocks currently account for about 35%-40% of transaction volume, and are the only clear, quantifiable, and sustainable sector theme in the entire tokenized stock market.
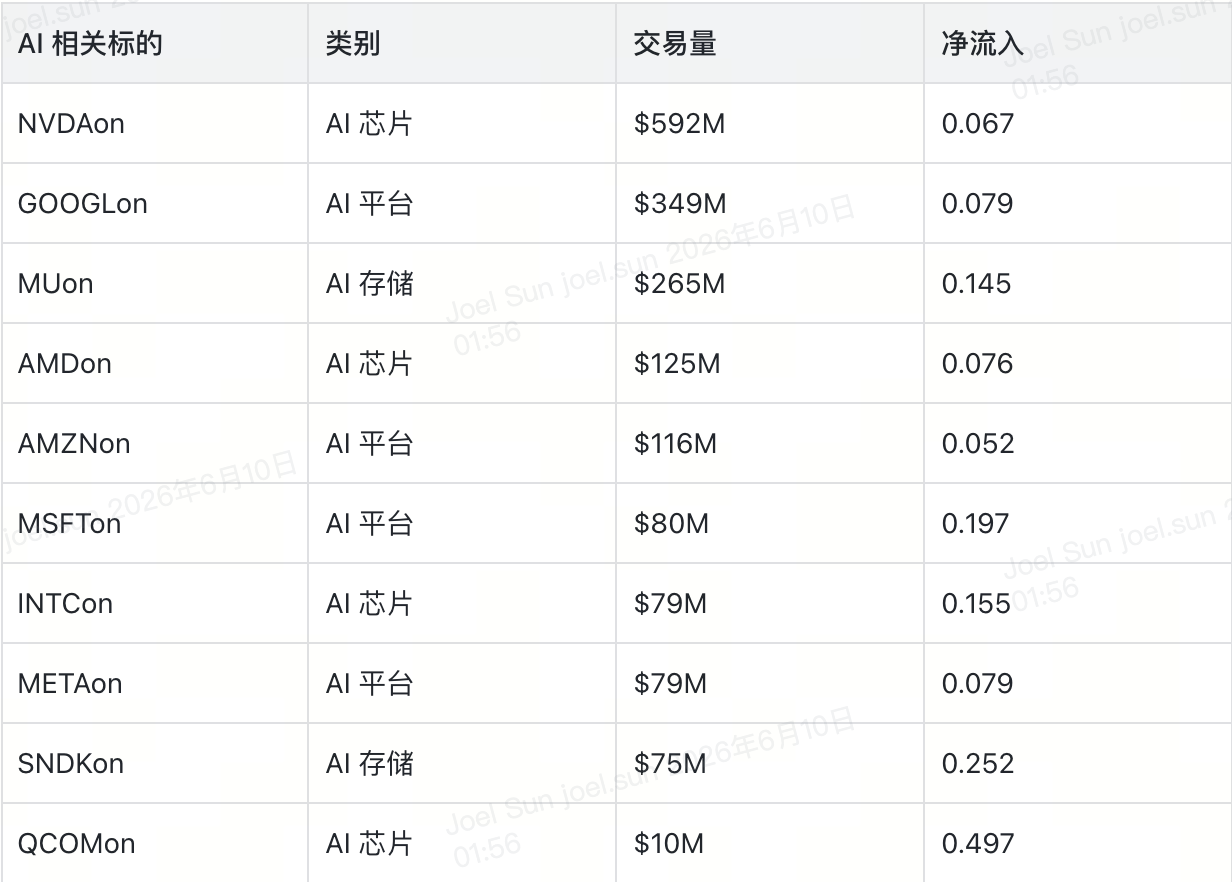
NVDAon is the liquidity king of the AI sector: with a transaction volume of 592 million dollars, and a net inflow of 6.7%. However, more directional accumulation signals actually appear beyond Nvidia—those targets in storage, chip infrastructure, and enterprise software have notably more aggressive net inflows:
Data source:Ondo Global Markets — Trading Analytics, Dune
This pattern conveys a clear signal: users are not just buying the largest AI leaders, but accumulating along the entire AI supply chain—from chips to storage, from cloud infrastructure to enterprise software, there are purchases occurring at every stage. This is the fundamental difference between tokenized stocks and "crypto-native AI tokens": users express their views on public market themes by anchoring assets directly to equity in listed companies, rather than speculating on a new on-chain narrative.
Of course, this also means that tokenized stock activities will always be influenced by the catalysts from Wall Street—earnings reports, guidance, interest rates, changes in supply chains, sector rotations. AI may be the most alluring entry point for tokenized stocks, but it also firmly ties this market to the cycles of traditional stocks.
Outside Tech Stocks: Emerging Demand for Commodity ETFs
The top-ranking transaction volumes are still blue-chip tech stocks, which is no surprise. However, if we only look at transaction volume rankings, we may miss some important signals.
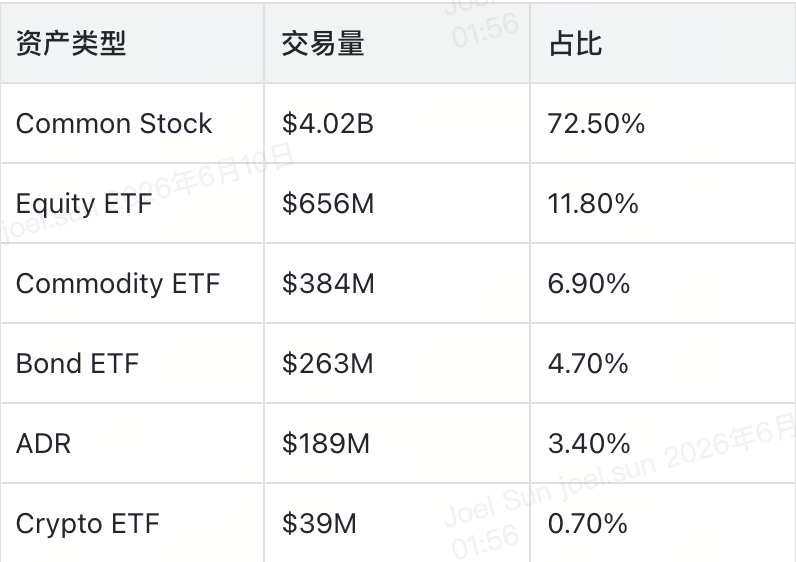
When broken down by asset type, common stocks account for 72.5% of transaction volume, followed by stock ETFs (11.8%), commodity ETFs (6.9%), bond ETFs (4.7%), ADRs (3.4%), and crypto ETFs (0.7%).
Data source:Ondo Global Markets — Trading Analytics, Dune
The numbers themselves are not surprising; what is surprising is the user-level signal. SLVon (tokenized silver ETF) is the asset with the most wallets on the BNB Chain, covering 19,531 users; GLDon (gold ETF) also has wide user participation. These two products may not match the transaction volume of mainstream tech stocks, but they outperform the majority of assets in terms of "coverage breadth".
The logic behind this is understandable: for many global users, exposure to commodities may be impossible to obtain within their local brokerage systems, or too costly. Tokenized silver and gold thus become the lowest barrier tools for accessing hard asset exposure, diversifying portfolios, hedging against currency price fluctuations, and inflation uncertainties.
This does not mean that commodity ETFs have surpassed tech stocks in transaction volume. However, it indicates that the market's demand for "access" is much broader than transaction volume rankings suggest. In the long term, the most viable use cases for RWA may be those combinations of "assets that are familiar enough" and "real access gaps": ETFs, commodities, indices, bonds, overseas stocks—these do not need to educate users about "what this is," but simply need to solve "how to obtain it".
The Same Asset, Two Chains, Two Completely Different Markets
Tokenized stocks are often discussed as a whole, but at least on the BNB Chain and Ethereum, they have emerged as distinctly different market profiles.
First, let's look at the volume: BNB Chain contributes 75.6% of total transaction volume, with about 168,000 independent wallets; Ethereum accounts for 24.4%, with approximately 21,000 wallets. The user scale of BNB Chain is about 8 times larger than Ethereum, with transaction volume about 3 times larger.
Next, consider the quality: the average transaction amount on Ethereum is 3,092 dollars, while BNB Chain stands at 1,791 dollars; Ethereum's per capita transaction volume is approximately 64,286 dollars, more than 2.5 times that of BNB Chain (approximately 25,000 dollars).
Data source:Ondo Global Markets — Trading Analytics, Dune
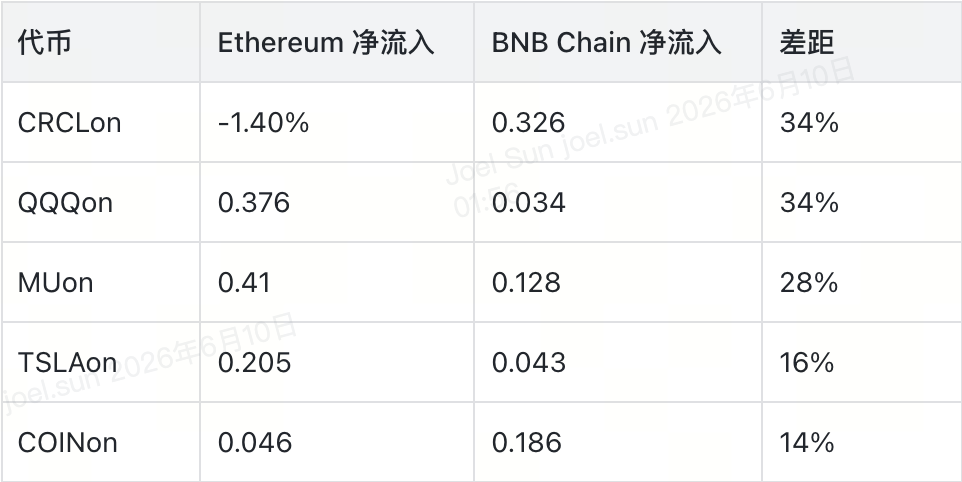
What most clearly illustrates the issue is the cross-chain comparison of fund flows for the same asset. CRCLon has a slight net sell on Ethereum (-1.4%) but strong buying on the BNB Chain (+32.6%); QQQon is the opposite—Ethereum users are accumulating significantly (+37.6%), while BNB Chain users are lukewarm (+3.4%). MUon, TSLAon, and COINon also show notable cross-chain behavioral differentiations.
Data source:Ondo Global Markets — Trading Analytics, Dune
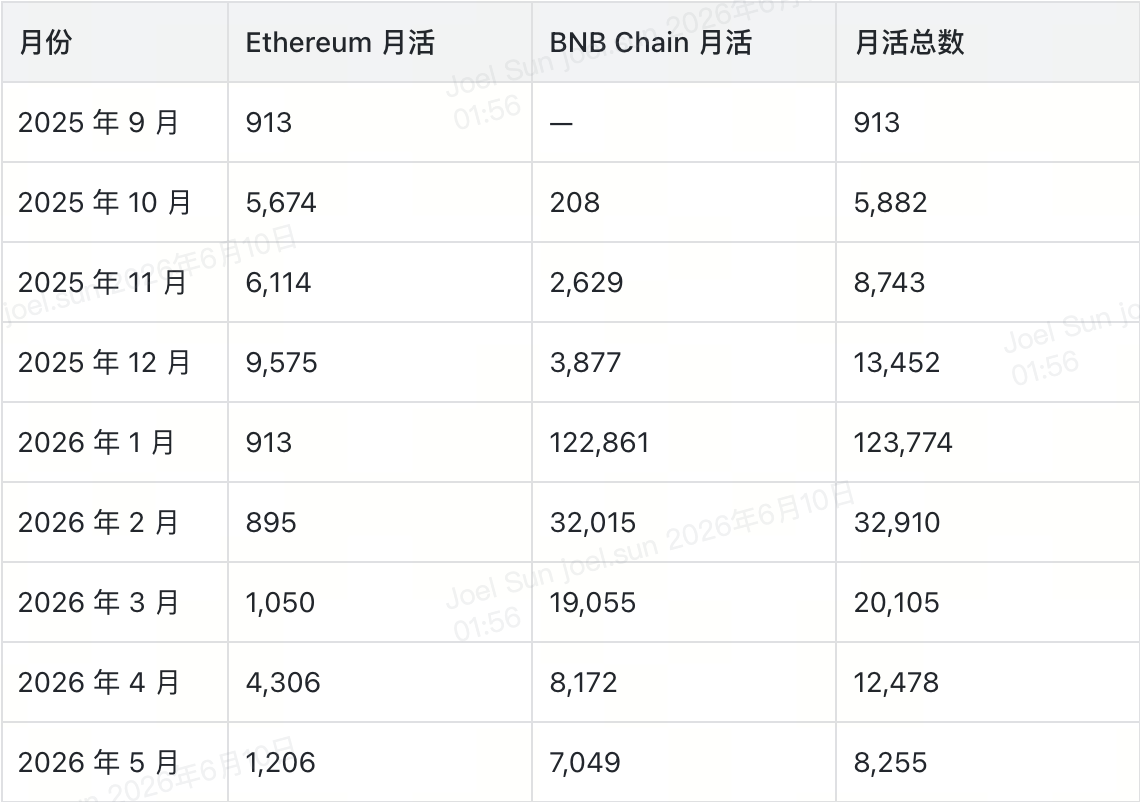
User growth data further exaggerates this differentiation. Monthly active users on BNB Chain soared from 3,877 in December 2025 to 122,861 in January 2026, then gradually declined—32,015 in February, 19,055 in March, 8,172 in April, and 7,049 in May. This curve nearly outlines a complete cycle of "activity-driven user acquisition → user loss → return to steady state." The monthly active scale on Ethereum is much smaller but also shows less volatility.
Data source:Ondo Global Markets — Trading Analytics, Dune
When combining the two chains, the current true steady-state monthly active users are closer to 8,000 to 12,000, rather than the scale suggested by the cumulative number of wallets. This gap itself is noteworthy—the cumulative wallet numbers are suitable for telling coverage stories, while monthly active and repeat behaviors are the hard indicators of "product-market fit."
This has direct strategic implications for RWA issuers and wallet platforms. "Moving assets on-chain" is only the first step. What truly determines distribution efficiency is: on which chain are the users? How do they trade? Which chain do they trust? What expectations do they have for product experience? The same tokenized stock, on one chain is an "asset held idle", while on another chain may be a "high-frequency trading tool"—this means that channel strategies cannot be one-size-fits-all.
The Next Step: From "Asset On-Chain" to "Market Access"
The first phase of RWA has addressed a fundamental issue: traditional assets can be moved on-chain. This question has been answered.
The next questions are more difficult: How to distribute? How to make users engage? How to build trust? How to retain users?
Tokenized stocks serve as a living example in this transformation process. Data has already indicated several things: users are expressing their views on public market themes such as AI through on-chain trading; they are accessing tools that were previously out of reach through ETFs and commodity products; and the behavioral patterns on different chains are distinct. But the boundaries are also clear—trading still follows Wall Street's clock, transaction volumes remain concentrated in large funds, and user retention is still in the early stages.
The value of tokenized stocks today lies not in "replacing Wall Street" — that narrative is too grand and inaccurate. Its true value is in making it simpler for those who are not within the service radius of traditional brokers, or whose standard market access channels are not friendly to them, to gain exposure to Wall Street assets.
For wallet products, the role is clear: lowering the barrier to asset discovery, simplifying the onboarding and execution pathways, helping users understand risks, and making portfolio management more intuitive. Those who excel in this experience will reap the dividends of tokenized stocks transitioning from "novelty" to "everyday allocation."
Tokenized stocks have already crossed a critical threshold: they are no longer just talk. The next question is whether they can genuinely embed themselves in the daily investment portfolios of global users based on a clear product structure, reliable liquidity, and a product experience that encourages repeated use.
This report's data is based on an analysis of on-chain trading activity on Ethereum and BNB Chain by Ondo Global Markets. For the complete English version of the report in PDF format, please visit:https://cdn.bitkeep.vip/operation/RWA_tokenized_stocks_report.pdf
免责声明:本文章仅代表作者个人观点,不代表本平台的立场和观点。本文章仅供信息分享,不构成对任何人的任何投资建议。用户与作者之间的任何争议,与本平台无关。如网页中刊载的文章或图片涉及侵权,请提供相关的权利证明和身份证明发送邮件到support@aicoin.com,本平台相关工作人员将会进行核查。


