Dear friends, I am Sister Qinglan. Today, June 7th, the market can be described as a tale of two extremes. In the focus news, there are two key points that must be highlighted: First, Bitcoin has fallen below the election day's closing price, dropping below $60,000 for the first time this year; this breach of such a critical psychological level directly undermines market confidence. Second, weekly capital outflows from the U.S. spot Bitcoin ETF reached $1.7 billion, a clear signal of institutional selling pressure. These two bearish signals combined have caused BTC to hover around $61,424, while on-chain data shows that whales have accumulated 1,723 BTC, valued at $105 million, within 24 hours, indicating that large capital is buying in at low levels. In this game of long and short, we need to rely on data rather than being swayed by emotions.
Current Price and Time
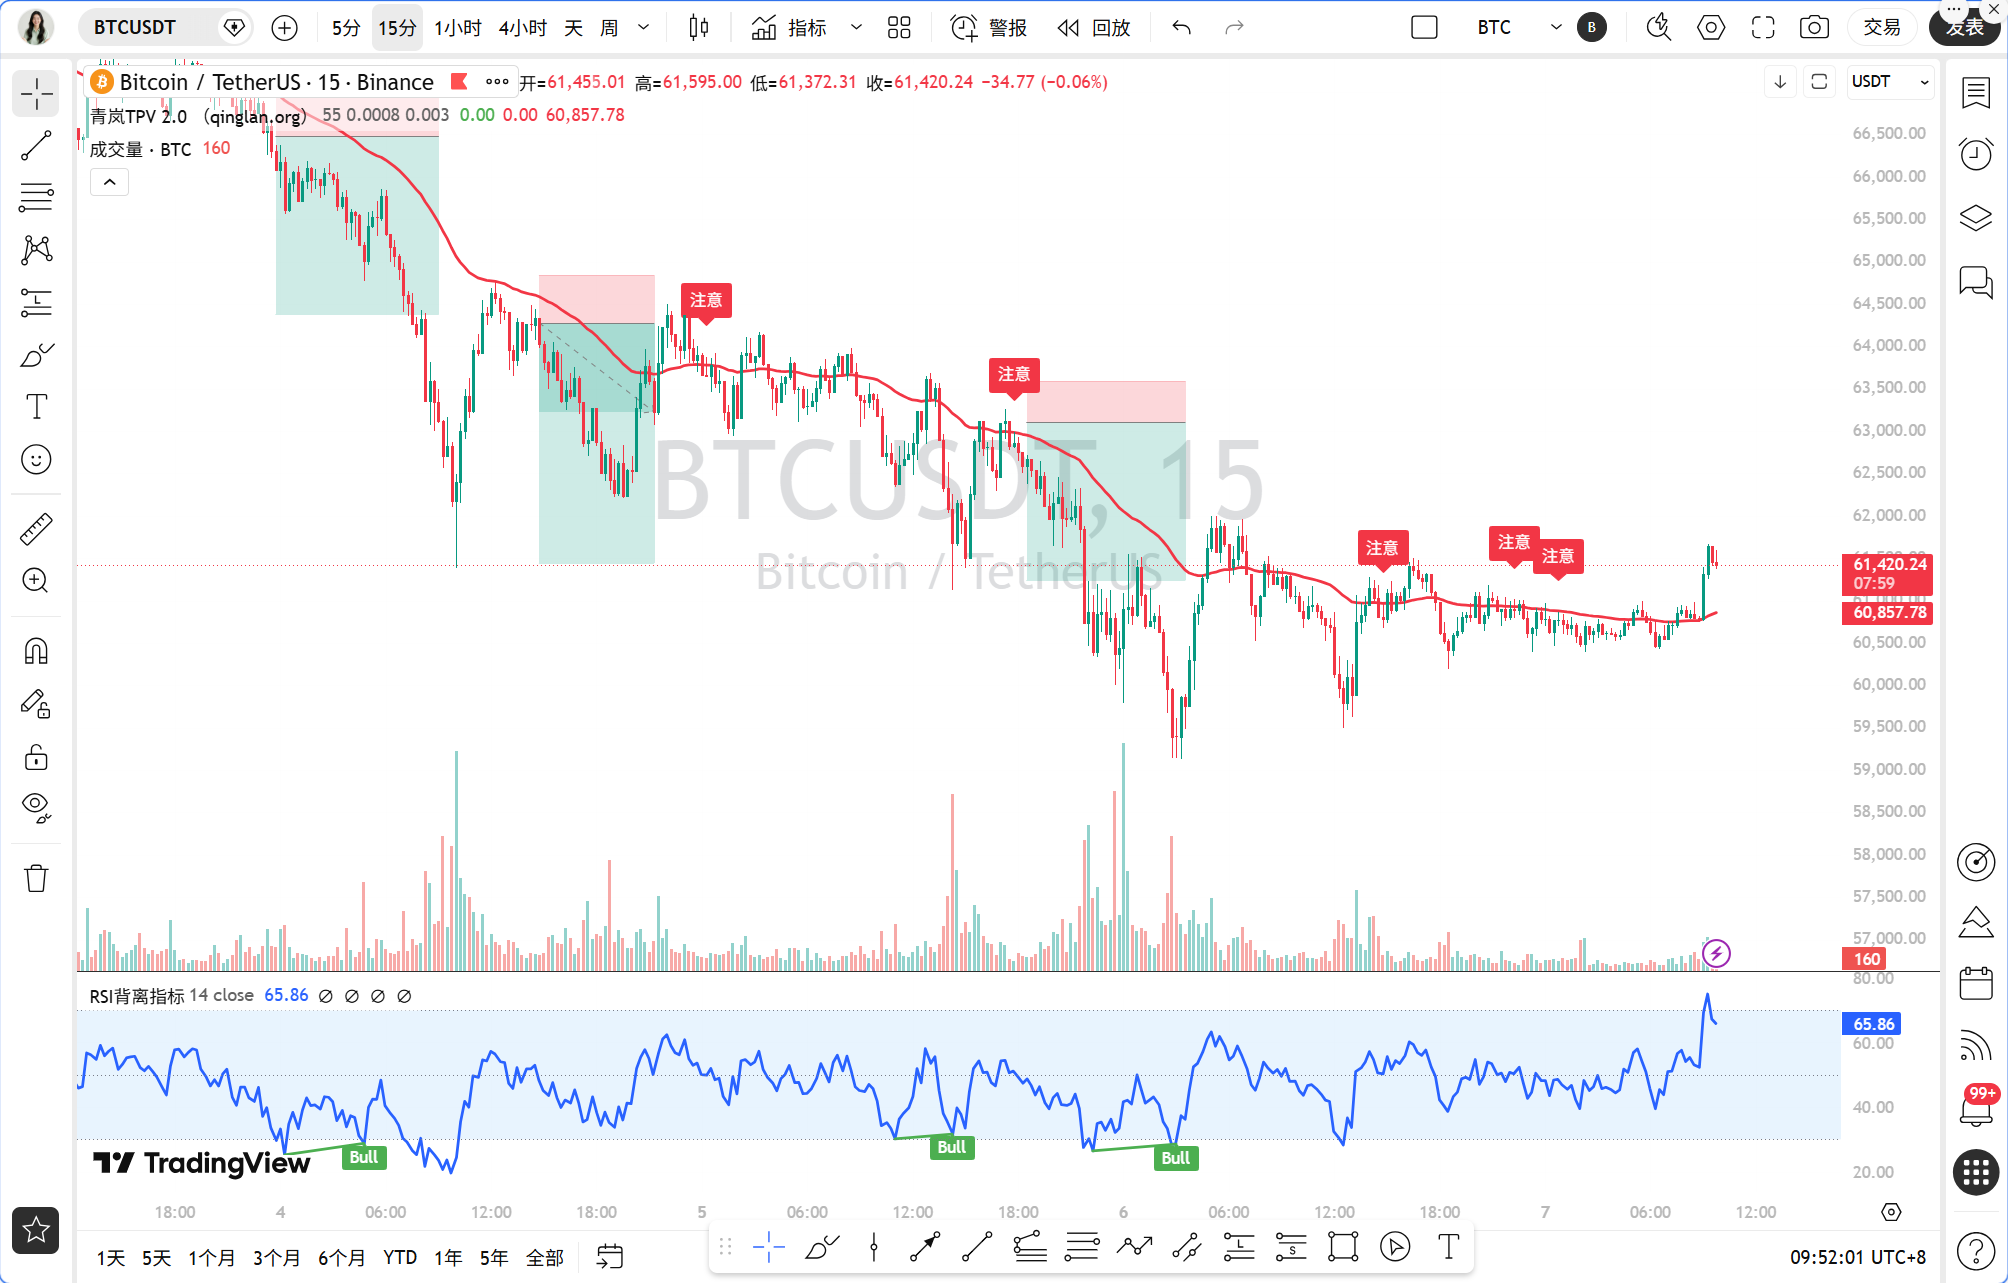
The current time is June 7th, 09:50, with BTC priced at 61,424 USDT. This level is only 0.32% away from the 1-hour EMA55 at $61,618.46, positioning it as a critical threshold. Market sentiment is extremely fearful, with the fear and greed index at only 12, although oversold signals have reached new highs since the pandemic; historical data indicates that such levels often accompany short-term rebound opportunities.
Multi-Cycle Status Overview
Looking at the daily chart, MA5=62,278.77, MA10=67,058.31, MA30=74,350.78, indicating a bearish arrangement. The MACD shows DIF=-4,144.45, DEA=-2,715.16, with a bar value of -1,429.30, demonstrating a continuous release of bearish momentum. RSI=6.75, which is in the extremely oversold zone; historically, when RSI goes below 10, BTC often experiences a rebound of over 5% within 1-3 days.
In the 4-hour cycle, MA5=60,899.11, MA10=60,798.23, MA30=63,816.53, indicating that prices are struggling around the short-term moving averages. The MACD shows DIF=-1,906.16, DEA=-2,181.88, with a bar value of 275.73. Although still negative, the shortening of the bars indicates that bearish momentum is waning. RSI=34.87, which is on the weaker side but not at extreme levels.
In the 1-hour cycle, MA5=60,877.08, MA10=60,768.45, MA30=60,915.68, with prices having risen above the short-term moving averages. The MACD shows DIF=-110.24, DEA=-210.41, with a bar value of 100.18, indicating a clear bottom divergence signal – prices are at new lows while the MACD bars are above the zero axis. RSI=63.96, which is in a neutral to strong region.
In the 15-minute cycle, MA5=61,323.16, MA10=61,080.92, MA30=60,806.59, reflecting a bullish arrangement in the short-term moving averages. The MACD shows DIF=173.08, DEA=85.05, with a bar value of 88.03, showing upward momentum. RSI=77.59, approaching overbought, indicating a need for short-term pullback.
Overall, the daily and 4-hour charts indicate a clear bearish trend, while the 1-hour and 15-minute charts show signs of stabilization and rebound, presenting a contradiction between the larger and smaller cycles that requires waiting for confirmation of key signals.
TPV Signal Verification
Now let's verify using the Qinglan TPV system. The 1-hour EMA55=61,618.46, with the current price at 61,424, which is below the EMA55, indicating a bearish trend.
The oscillation auxiliary data shows that among the last 8 hourly candlesticks, the closing price has exceeded EMA55 0 times and crossed it 0 times, with the price being 0.32% away from EMA55, not meeting the oscillation threshold, indicating that we are currently in a one-sided bearish trend.
Short conditions check: First, the price is pressured below EMA55, with 2 consecutive hourly closing prices below EMA55, satisfying this condition. Second, resistance must be observed in terms of whether there is a long upper shadow or a top divergence. Currently, the hourly candlestick is near 61,424, with the previous high around 61,800, but without a significant long upper shadow, the condition is not met. Third, weak rebound indicated by MACD bars shortening for 2 cycles, but the 1-hour MACD bar value of 100.18 is a positive number and continues to increase, alongside RSI rising from 63.96, indicating that rebound momentum is still present, failing to meet the criteria. Therefore, short conditions are not established.
Long conditions check: First, the price remains stable above EMA55, with 2 consecutive hourly closing prices above EMA55, but the current price is below EMA55, failing to meet this condition. Second, support must be evaluated with long lower shadows or bottom divergences. Recently, the 1-hour candlestick around 60,800 has shown a long lower shadow, forming short-term support. Third, declining momentum loss, with MACD bars shortening for 2 cycles, while the 1-hour MACD bar value of 100.18 is positive and continues to amplify, though it's essential to note that this is a rebound following a bottom divergence, indicating that momentum is indeed increasing. Overall, long conditions are also not fully satisfied.
Thus, the current signal from the TPV system is: bearish trend but no short signal, while long conditions are immature, placing us in a waiting zone. This position tests patience; do not blindly bottom-fish simply because the price is low, nor should you chase shorts just because the trend is bearish.
On-Chain/Funding Situation
In terms of on-chain data, the fear and greed index is at 12, indicating extreme fear, which historically corresponds to a stage bottom. Whales have accumulated 1,723 BTC, valued at $105 million, suggesting that large funds are gathering at low levels. However, U.S. spot Bitcoin ETF outflows amounting to $1.7 billion cannot be ignored. Additionally, geopolitical tensions and escalating situations between the U.S. and Iran could divert funds to gold, putting short-term pressure on the crypto market. In summary, the funding situation is intertwined with bulls and bears, with whales and ETF funding moving in opposite directions, necessitating attention to any potential signals of ETF capital inflow.
Key Attack and Defense Levels
The first resistance level above is $61,618 from the 1-hour EMA55, representing the boundary between bulls and bears; stabilizing here will open up rebound space. The second resistance level is $60,915 from the 1-hour MA30, but the price has already crossed this, so the next critical resistance is near $60,899 from the 4-hour MA5, which has actually been breached. The next resistance is at $60,798 from the 4-hour MA10, but more critically is $63,816 from the 4-hour MA30, a mid-term pressure level. To the downside, short-term support is seen around $60,800 near the recent lows of the hourly long lower shadow. If breaches, the next support is at the integer $60,000, which is the election day's closing price, and breaching this could trigger panic selling. Further support is at $58,000, which is a prior low.
Trading Thoughts
Based on the signals from the TPV system, we are currently in a bearish trend but without a short signal, while long conditions are immature, so the trading strategy should focus on observing for clear signals.
Direction: Remain cautious and do not actively go long or short.
Entry Conditions: If the price breaks through and stabilizes above $61,618 from the 1-hour EMA55 and there are 2 consecutive hourly closing prices above this line, alongside MACD bars continuing to widen and RSI above 60, consider a light long position. If the price falls below the $60,800 support and the 1-hour MACD bars start to shorten with RSI dropping below 50, consider a light short position.
Stop Loss: Set the stop loss for long positions below $60,800 and for short positions above $61,618.
Target Levels: For long positions, the first target is $62,500 and the second target is $63,800. For short positions, the first target is $60,000 and the second target is $58,000.
Risk Warning
Current market sentiment is extremely fragile, and any unexpected news may trigger significant volatility. Please strictly control your position size, with each transaction's risk not exceeding 2% of total funds.
Follow Qinglan's crypto class to seize more trading opportunities! Feel free to visit the official website www.qinglan.org
📊 Qinglan TPV Trading Strategy Backtest Reference
🕒 Last backtest time: 06-07 07:00:01
Total analysis: 2076 Backtests: 1660 Accuracy: 68.1% (1130/1660)
免责声明:本文章仅代表作者个人观点,不代表本平台的立场和观点。本文章仅供信息分享,不构成对任何人的任何投资建议。用户与作者之间的任何争议,与本平台无关。如网页中刊载的文章或图片涉及侵权,请提供相关的权利证明和身份证明发送邮件到support@aicoin.com,本平台相关工作人员将会进行核查。


