Crypto Circle Academician: On July 27, the Ethereum (ETH) cycle signal is forming resonance, and the market change window is approaching. Be sure to set defenses in advance? Latest market analysis reference
The current price of Ethereum is 1911, and this wave of fluctuations hides many details. Many people have their mindset shattered by the back-and-forth volatility, sometimes feeling it will surge to 2000, and other times fearing it will drop back to 1800, chasing highs and killing lows, losing in a blurred manner. In fact, as long as you combine the signals from the daily and 4-hour charts, you can see the true intentions of the main force. Today, I will use these two charts to break down the key support, resistance levels, and long-short signals for you, even marking the stop-loss level clearly. After reading, you will know how to operate without stepping into pitfalls, and beginners can directly use it as a reference.
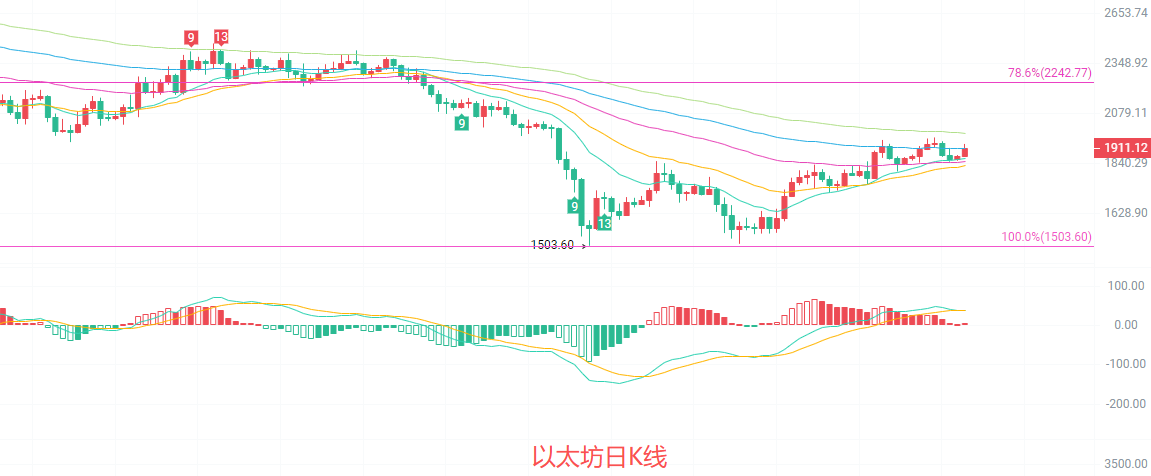
The daily candlestick is currently in a key game interval. From the EMA moving averages, the price is currently running near the 15/30/60-day moving averages, forming strong short-term support around 1849-1864, while above, the EMA120 near 1982 and the upper Bollinger Band at 1967 constitute double pressure. The MACD indicator shows that the red bars are continuously shrinking; although the DIF and DEA are still above the zero axis, the golden cross momentum has weakened, and bullish strength is showing a phase of attenuation. The overall Bollinger Band is in a contracting state, with the price volatility range narrowing, indicating that the market is choosing a direction. If it cannot effectively break through the upper Bollinger Band, it is highly likely to retest the support around the Bollinger middle track of 1847.
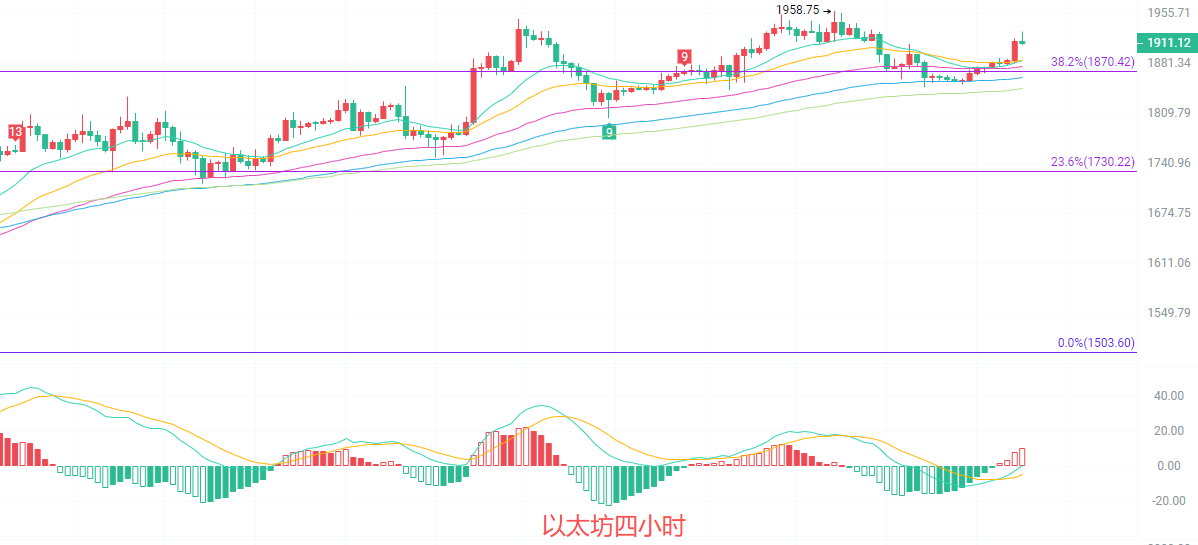
The 4-hour candlestick previously faced resistance and fell back at 1958, and is currently oscillating above the 38.2% Fibonacci retracement level of 1870. The EMA moving average system shows a bullish arrangement, with strong support formed around the 15/30/60-day moving averages at 1877-1886. The Bollinger Band shows slight expansion, and the price is running above the middle track of the Bollinger Band, indicating that the short-term trend is still on the bullish side. The MACD indicator's red bars continue to expand; the DIF crosses above the DEA to form a golden cross, and bullish momentum is being released. However, the 50% Fibonacci pressure level around 1983 still exists. If it cannot break through this level, it is highly likely to maintain a fluctuating trend within the range of 1870-1950.
Short-term reference:
If it does not break below 1850 to 1800, go long with a stop loss at 1760, targeting 1930 to 1970.
If it does not break above 1980 to 2020, go short with a stop loss at 2050, targeting 1930 to 1890.
The specific operations should be based on real-time market data. For more detailed information, you can consult the author. The article may be published with a delay, and the suggestions are for reference only; the risk is borne by yourself.

Warm reminder: The above content is solely created by the author of the public account. The advertisements at the end of the article and in the comments section have no relation to the author. Please distinguish carefully. Thank you for reading.
免责声明:本文章仅代表作者个人观点,不代表本平台的立场和观点。本文章仅供信息分享,不构成对任何人的任何投资建议。用户与作者之间的任何争议,与本平台无关。如网页中刊载的文章或图片涉及侵权,请提供相关的权利证明和身份证明发送邮件到support@aicoin.com,本平台相关工作人员将会进行核查。


