If you've been tracking crypto prices over the last couple days, you already know the broader picture: the market is getting hammered. Bitcoin cratered below $67,000, its worst level since April, and ETFs are bleeding.
But while things aren’t looking great for Bitcoin in the near term, Ethereum—the second largest crypto asset by market capitalization—is getting hit worse.
Ethereum fell below $2,000 on June 2 and hasn't looked back. There are several possible reasons, beyond the typical macroeconomic winds, why ETH may be especially bearish at the moment: key developers at the Ethereum Foundation have jumped ship, some very vocal, high-profile supporters have sold their bags, and Ethereum ETFs have now logged 15 consecutive trading days of net outflows.
On Myriad, a prediction market built by Decrypt's parent company Dastan, current odds on Ethereum’s next move tell you everything you need to know about ETH sentiment at the moment. Traders are now pricing in a 71% chance that Ethereum drops all the way down to $1,500 before making any kind of comeback. Those odds are up 25% since mid-May.
Ethereum price: What the charts say
Today's Ethereum price action is brutal in its clarity. ETH opened at $2,004, tested a high of $2,018—barely clearing the broken $2,000 level before sellers stepped in—then plunged to an intraday low of $1,814.90, showing a clean rejection and continuation event.
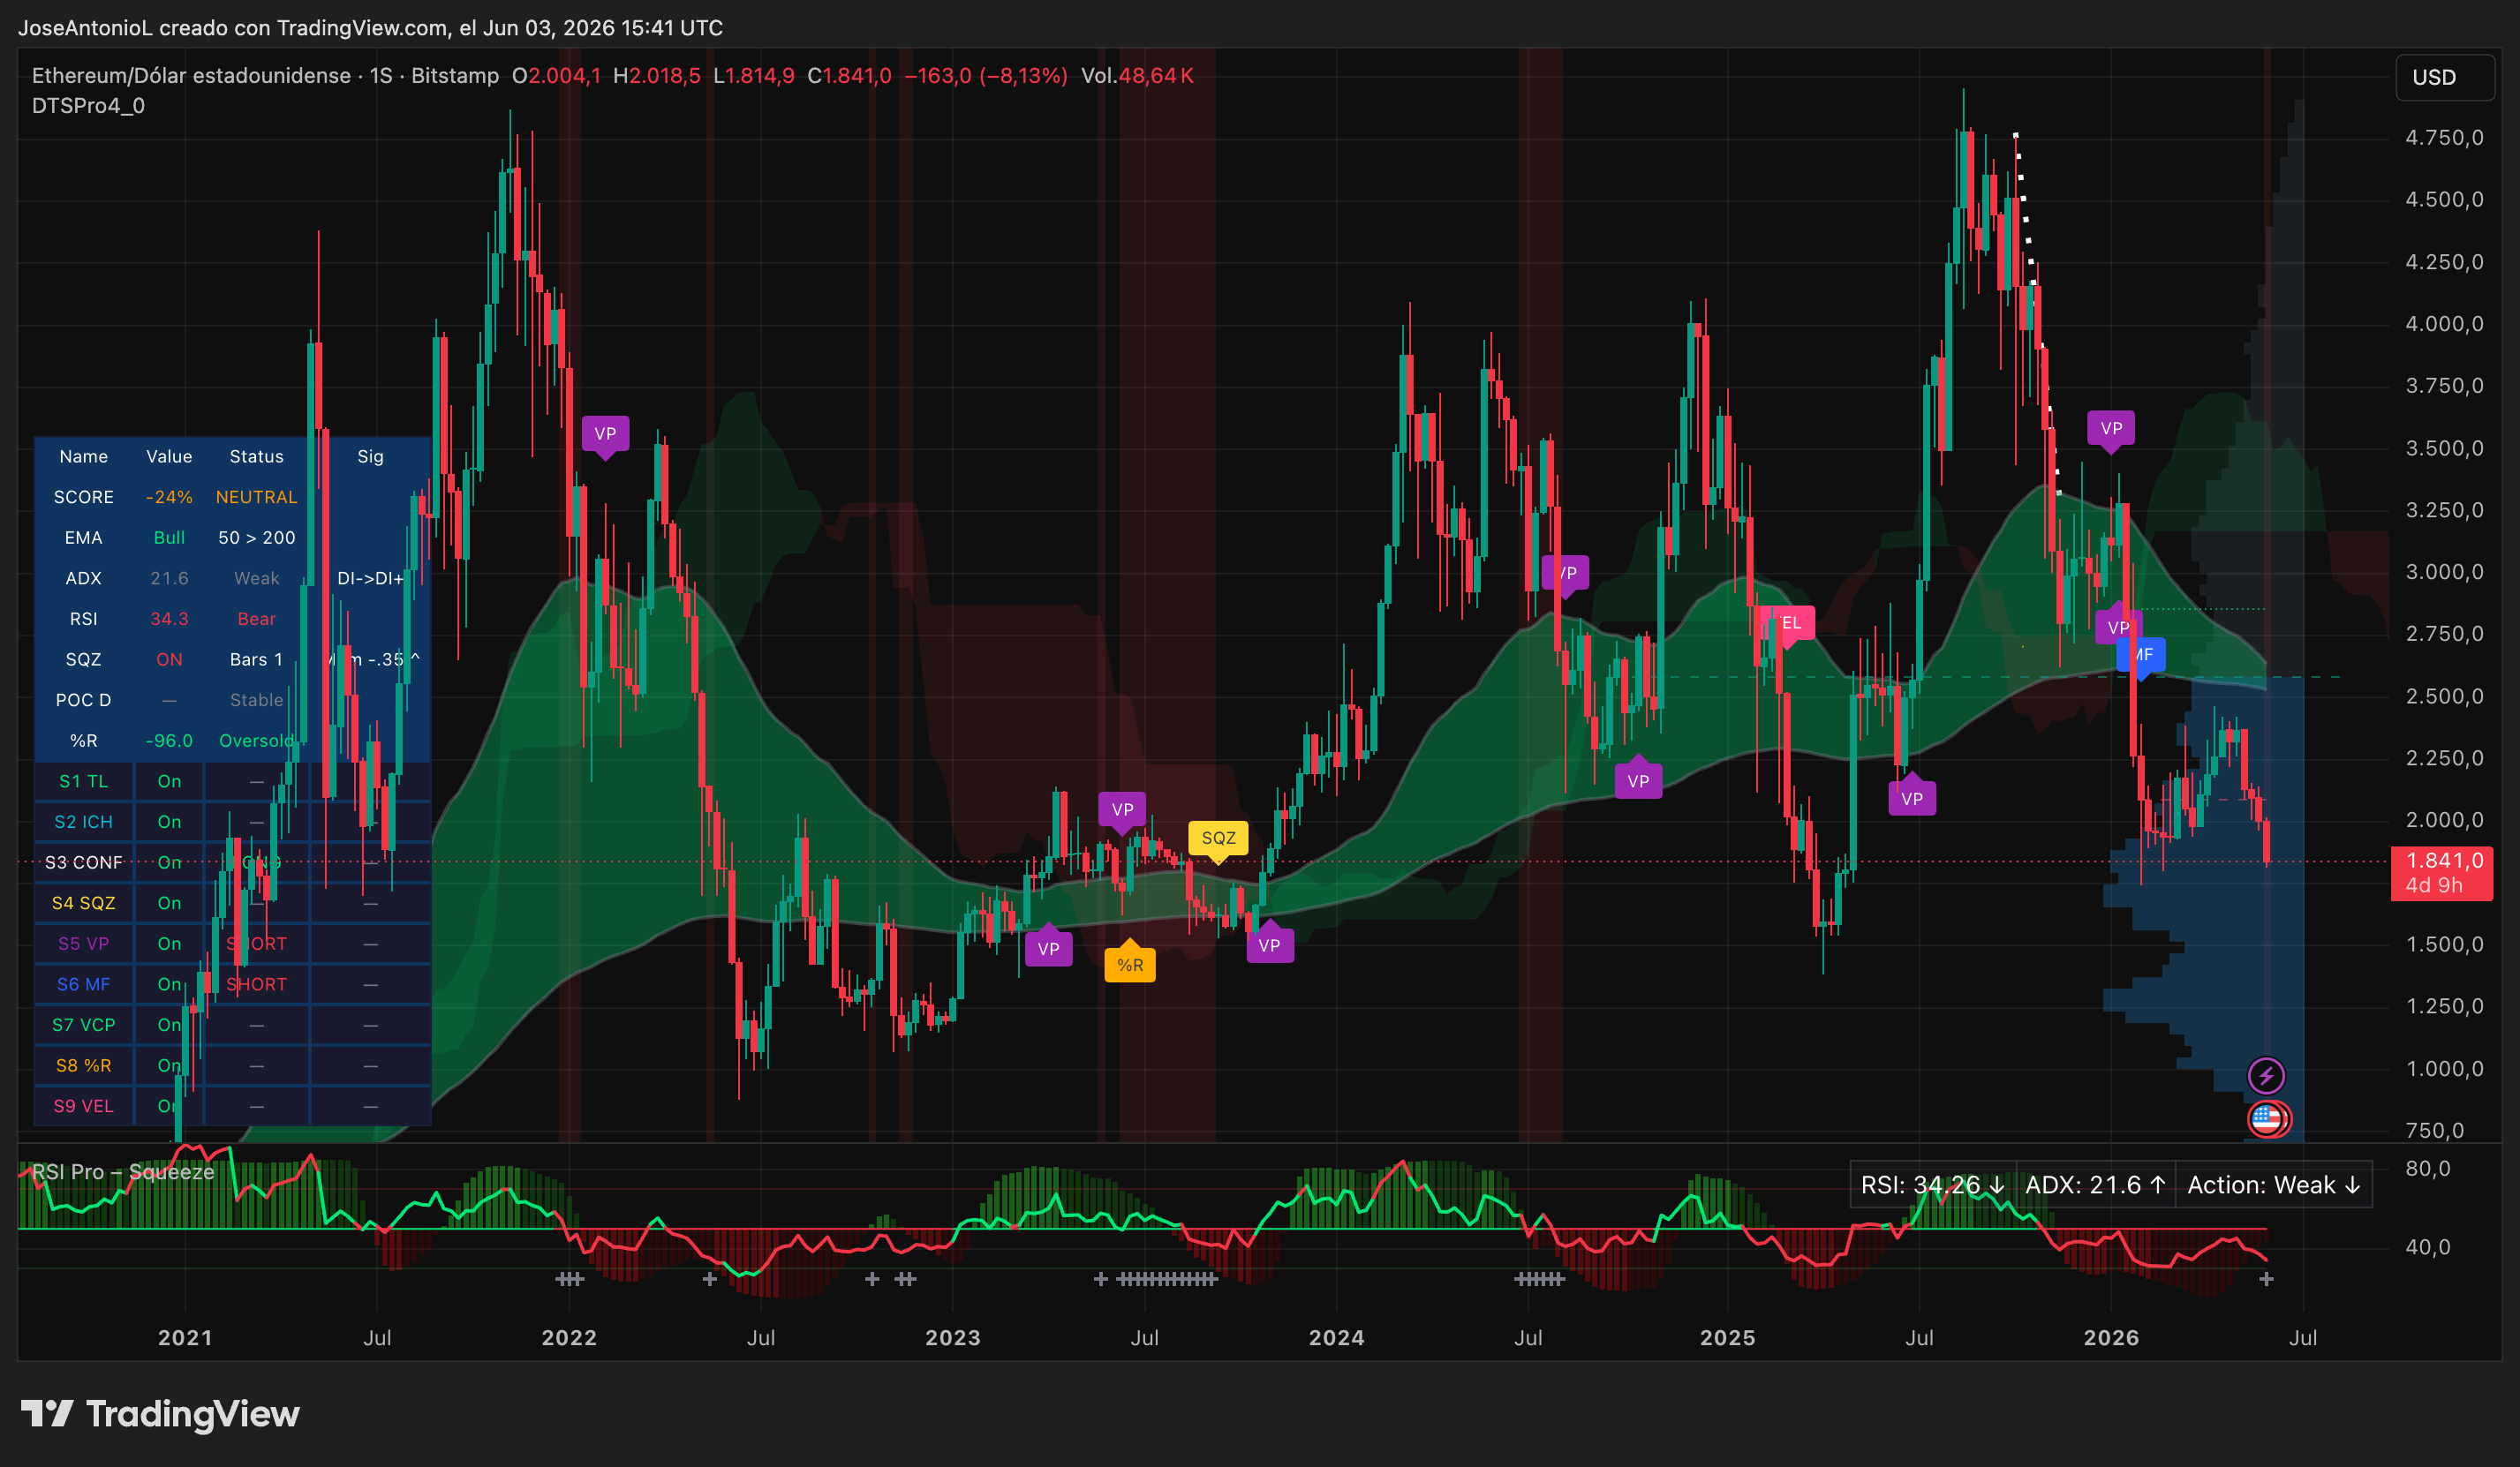
Ethereum price data. Image: Tradingview
The pattern of lower highs and lower lows that's been in place since Ethereum's all-time high of $4,954 in August 2025 is still very much intact.
The chart shows a critical level around $1,700. If ETH doesn't find buyers and stage a meaningful bounce at or above that zone today or in the next few sessions, there's very little standing between the current price and the $1,400 support cluster—a region that acted as major resistance-turned-support in early 2023.
That's roughly 25% below current levels if it touches the minimums from 2025, which is exactly what the prediction market is pricing in.
The Relative Strength Index, or RSI, sits at 34.26—in bear territory and approaching oversold. RSI measures overbought and oversold conditions on a scale of 0 to 100; readings below 30 typically signal a market that's been sold too hard too fast. We're not there yet, and a reading in the mid-30s doesn't automatically mean a bounce is coming. It just means sellers have had the wheel for a while, but there is room for a bigger dip before oversold levels show their effect.
The Average Directional Index, or ADX, reads 21.6—technically "weak" (the price is not dropping as fast as it was previously) but trending upward. ADX measures the strength of a trend regardless of direction; readings above 25 confirm an actual trend is developing. The fact that it's creeping toward that threshold while the price of ETH is falling is not encouraging for traders.
The EMAs—Exponential Moving Averages—paint a complicated picture. The chart still shows the 50-day moving average above the 200-day, technically a "golden cross" on the long timeframe. But ETH is trading well below both averages right now, which means those levels are acting as resistance, not support. Price has to fight uphill just to get back to neutral. The 50-day EMA sits around $2,194, and the 200-day is near $2,510. Both are ceilings, not floors, at current prices.
The gap between both EMAs is closing fast, which could potentially end up in a “death cross”—the inverse of a golden cross and a textbook bearish indicator in technical analysis.
The Squeeze Momentum Indicator is on, firing with a momentum reading of -0.35. The Squeeze fires when volatility compresses—like a spring being coiled—and then measures which direction the energy releases. This hopium indicator may be a sign of prices compressing before a bounce, but it does not necessarily mean there will be a change of direction, only that right now there is a fight between bulls and bears that have stagnated prices.
Moon or doom? That is the question
The bull thesis from here is essentially a mean-reversion play. With RSI near 34, a squeeze in play, and ETH down roughly 60% from its all-time high, the argument is that the selling has been overdone and any macro relief—a softer-than-expected jobs report, a Fed pivot signal, or de-escalation in the Middle East—could trigger a sharp short-squeeze bounce. The $1,700 zone also represents a significant psychological level that bulls will attempt to defend.
There's also the Ethereum roadmap. The network's Glamsterdam upgrade, confirmed by the Ethereum Foundation for Q3 2026, targets a major gas limit expansion and 10,000 transactions per second on the layer-1 network. If institutional sentiment stabilizes around that catalyst, buying could return before prices get much worse. Some buyers may see the current discount as an opportunity rather than a warning.
The problem with the bounce thesis is that none of the macro triggers are imminent, and the technicals aren't supporting a reversal yet. The 15-day ETF outflow streak for Ethereum is a sign of how the overall market feels. Institutional money leaving isn't a sentiment issue that resolves in one session—it reflects a broader rotation out of crypto and into AI equities, where earnings visibility is real and tangible in a way that ETH's network utility isn't, at least right now.
The chart structure is also working against buyers. ETH has printed lower highs and lower lows consistently. Every bounce attempt since breaking $2,500 has been capped and reversed. The $2,000 level, which had held as support for weeks, broke with conviction yesterday.
Ethereum price data. Image: Tradingview
The views and opinions expressed by the author are for informational purposes only and do not constitute financial, investment, or other advice.
免责声明:本文章仅代表作者个人观点,不代表本平台的立场和观点。本文章仅供信息分享,不构成对任何人的任何投资建议。用户与作者之间的任何争议,与本平台无关。如网页中刊载的文章或图片涉及侵权,请提供相关的权利证明和身份证明发送邮件到support@aicoin.com,本平台相关工作人员将会进行核查。


