Liying in the Crypto Circle: Interpretation of the Latest Market Trend for 6.4 Bitcoin (BTC) and Operational Suggestions
Article published on 2026.6.4——00:30
Dear family, today the trend of Bitcoin is really making people anxious! The current price is 66123, and as seen in the chart, the price has been sliding down like on a slide over the past few days, previously hovering around 78000, now it has directly dropped to sixty-six thousand. The K-line chart is filled with red bearish bars, indicating that sellers are significantly outnumbering buyers, and the bulls basically have no strength to fight back. However, let's not be too pessimistic; if it drops too much, there might be a rebound, but the current trend hasn't turned around yet. Those looking to buy the dip should be cautious and not rush in; it’s better to assess the situation clearly before making a move. After all, the crypto market is highly volatile, preserving the principal is more important than anything else. We should wait for clear signals before taking action, and not be fooled by short-term fluctuations.
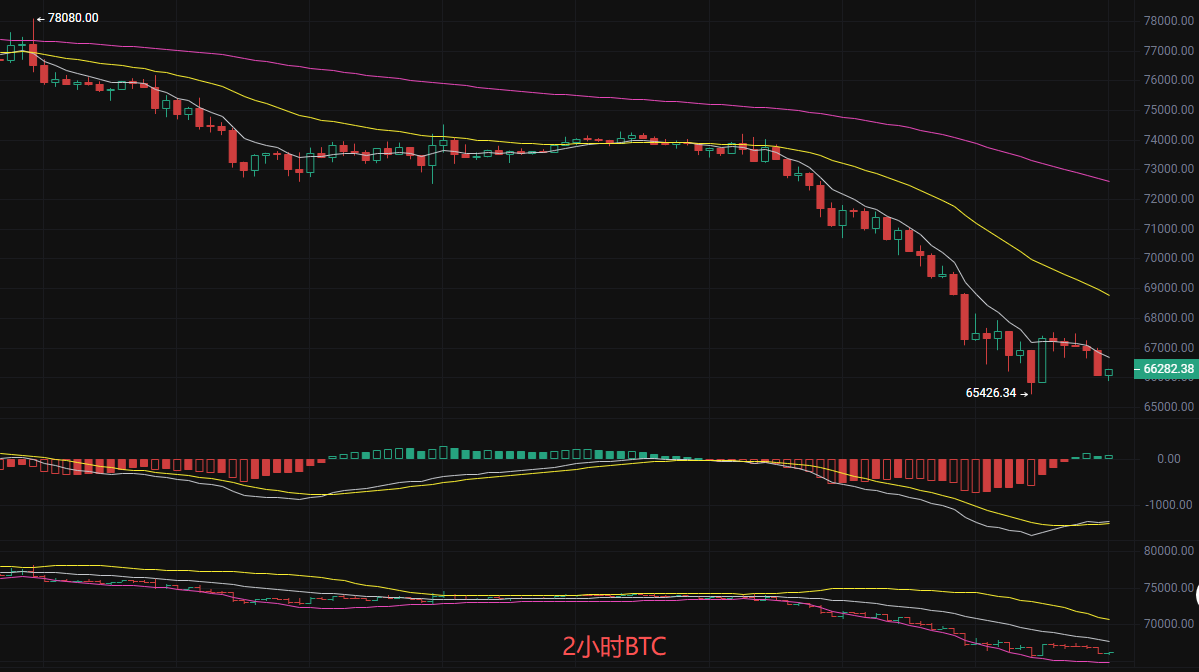
First, let's look at the moving average system. The EMA7, EMA30, and EMA120 are in a bearish arrangement; the short-term moving averages are below the long-term moving averages and the price is far below all moving averages, indicating a clear downtrend with multiple resistance levels above. The MACD indicator is even worse, with the DIF and DEA both below the zero axis facing downwards, and the red energy bars continue to expand, meaning the bearish momentum is still increasing, making a reversal difficult in the short term. Regarding the Bollinger Bands, the price is running closely to the lower band at 64983, while the middle band at 68031 has become a strong resistance, and the upper band at 71078 is even further out of reach. This combination of being close to the lower band + moving average bearish + MACD death cross is a typical weak signal, and a rebound is highly likely to be a trap for the bulls. Shorting should also be cautious, as there may be a technical correction after being oversold.
Short-term reference:
Go Long at 65000-64500, exit below 64000, target above 66500 aiming for 67500
Go Short at 68500-69000, exit below 70000, target below 67500 aiming for 65500
The above content is exclusively original by Liying; please indicate the source when reprinting! There may be a delay in the article's review and publication, and the market changes rapidly. The above advice is for reference only, and risks are to be borne by individuals. I hope Liying's appearance will be helpful to you!
The content of this article is timely, for reference only, and risks are to be borne by individuals.

Warm reminder: The above content is solely created by the author on Weibo; the advertisements at the end of the article and in the comment section are not related to the author. Please identify carefully, thank you for reading.
免责声明:本文章仅代表作者个人观点,不代表本平台的立场和观点。本文章仅供信息分享,不构成对任何人的任何投资建议。用户与作者之间的任何争议,与本平台无关。如网页中刊载的文章或图片涉及侵权,请提供相关的权利证明和身份证明发送邮件到support@aicoin.com,本平台相关工作人员将会进行核查。