Core viewpoint: The current digital currency market shows a unidirectional decline, with Bitcoin and Ethereum both approaching key support zones below. If these key positions are lost, the market may open a new round of deep correction.
1. Bitcoin (BTC) market analysis: Support lost, pay attention to the 58,000 level
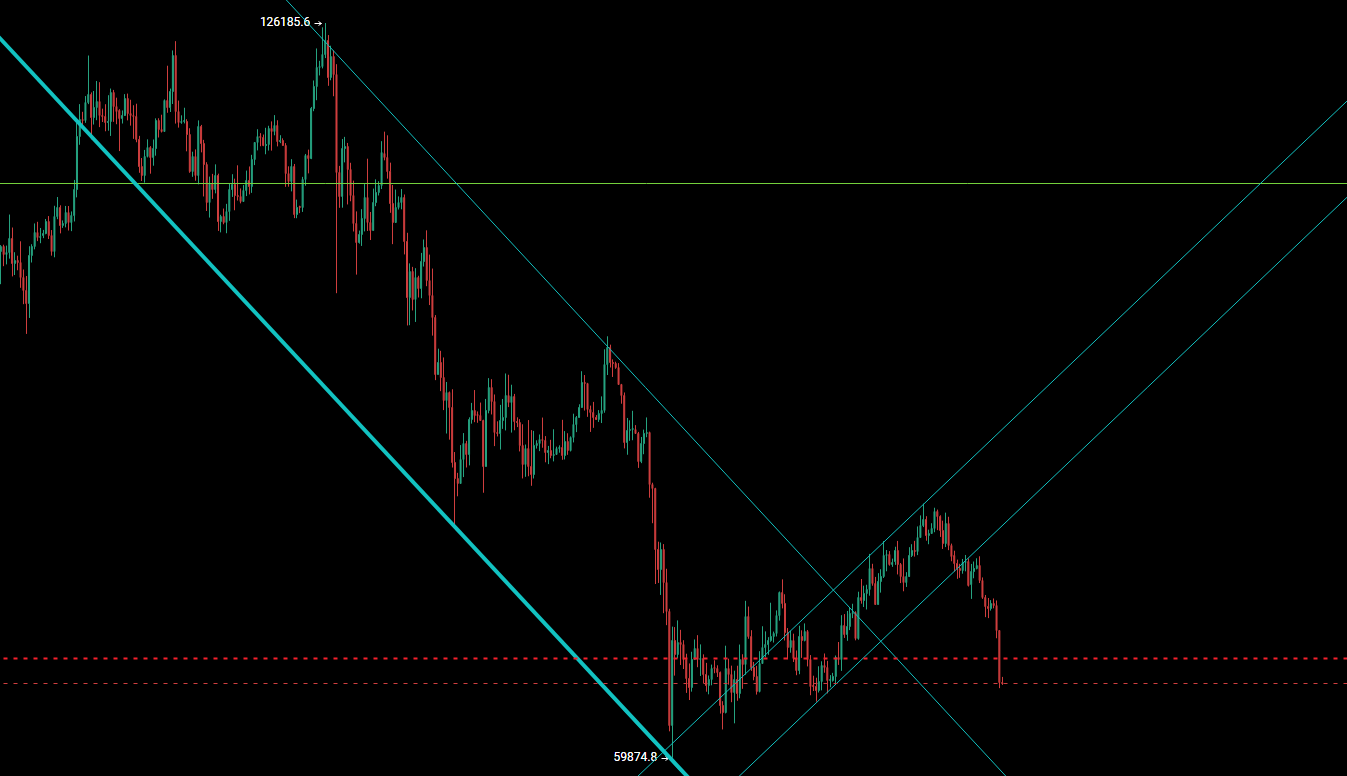
Current situation: The market exhibits characteristics of "unidirectional decline," with previous support levels continuously broken and a lack of effective rebounds.
Key points below:
• Recent support: $58,900 - $58,850. This is an important observation range at the four-hour level.
• Core support: Around $58,000. This position is a key support level confirmed by both the four-hour and daily charts, holding significant technical meaning.
Trend derivation:
• If the price effectively breaks below the $58,900 - $58,850 range, it will likely test the strong support at $58,000.
• Key logic: $58,000 is the low point of the previous historical decline channel (starting from $126,000) and also the starting point of the rebound in February-March. If this position is lost, it means that the rebound structure since February may officially end, and the market will return to seeking a bottom within a longer-term downward channel.
2. Ethereum (ETH) market analysis: The 1,830 defense line is precarious
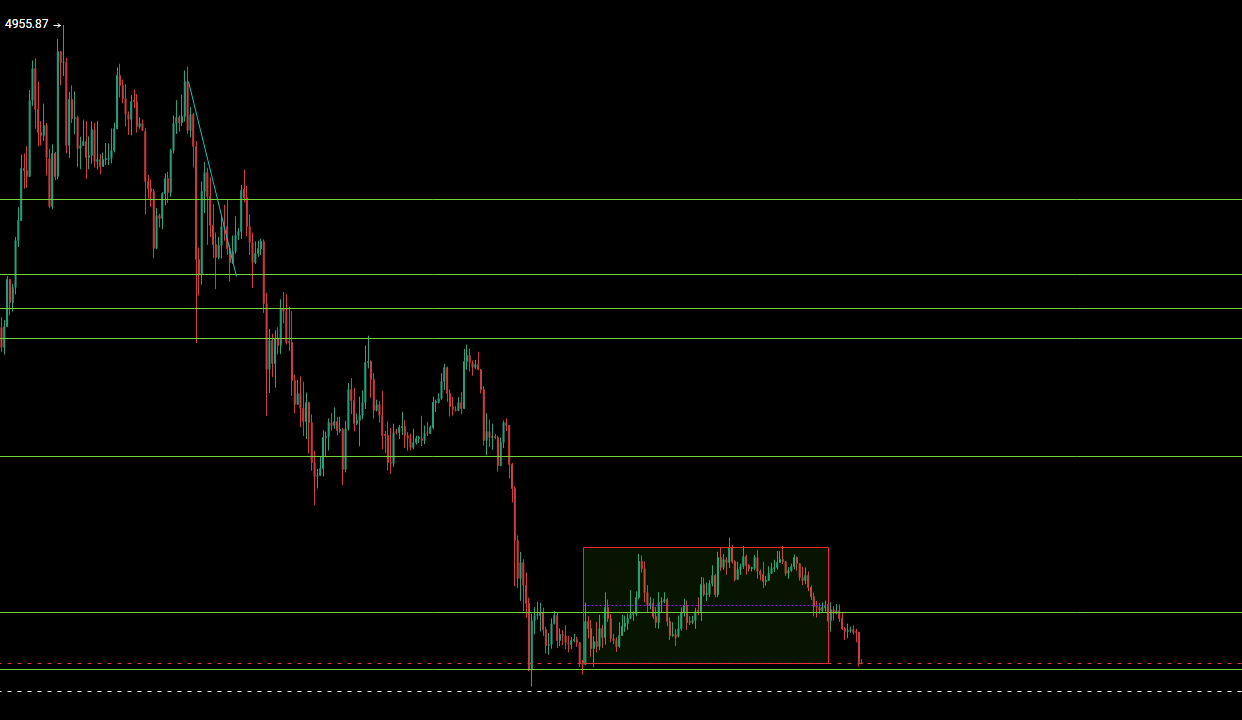
Current situation: After stabilizing above $2,100 for several days, the price has dropped to a critical region.
Life-and-death defense line: The range of $1,850 - $1,820. This range is currently the last barrier for the bulls.
Risk derivation (if breaking the 1,830 level):
• First target: $1,700 ("starting with 17").
• Second target: $1,384 (entering the "starting with 14" range).
• This means that if key support is lost, the downward space will be further opened up.
3. Operating strategy thoughts (original viewpoint refinement)
The core strategy of the analyst team is: align with the unidirectional trend, capturing opportunities for higher short positions during rebounds.
Main direction: Focus on "high shorts" (short at highs) after rebounds.
Short-term operation example for Ethereum:
• Watching for rebounds: If the four-hour chart can form stabilization signals such as "green doji star," attention can be given to the possibility of a rebound up to the $4,580 - $4,600 range.
• Chasing the decline: If the price breaks below $4,460, then the target below looks towards around $4,420.
Summary and reminders
The current market sentiment is bearish, with $58,000 (BTC) and $1,830 (ETH) being two critical technical thresholds. Investors should closely monitor the gains and losses at these positions, as the outcome will determine the direction of the mid-term market structure. When the trend clearly indicates a downward movement, the strategy should primarily be to follow the trend, set strict stop losses, and be vigilant about potential sharp fluctuations at key points in the market.

免责声明:本文章仅代表作者个人观点,不代表本平台的立场和观点。本文章仅供信息分享,不构成对任何人的任何投资建议。用户与作者之间的任何争议,与本平台无关。如网页中刊载的文章或图片涉及侵权,请提供相关的权利证明和身份证明发送邮件到support@aicoin.com,本平台相关工作人员将会进行核查。