Today's market sentiment can be said to have dropped to freezing point. In the focal news, Strategy sold off BTC for the first time in three years; this iconic event directly shook market confidence, and the end of the coin-holding myth has caused panic among many veteran players. At the same time, the US-Iran conflict escalated, with Iran launching missile attacks on US ships and bases, and geopolitical risks sharply increased, suppressing risk assets like BTC. The combination of these two strongly negative messages led to a 6.51% drop in BTC within 24 hours, currently quoted at 66910 USDT. The market is in extreme fear, with the fear and greed index at only 23, but at such times, we need to calmly analyze and find real trading opportunities.
Current price and time
The current time is June 3, 2026, 10:17, with BTC priced at 66910 USDT. The 24-hour decline is 6.51%, with a market share of 56%, showing BTC still dominates the overall market, but short-term selling pressure is huge.
Multi-period status overview
On the daily level, BTC has fallen below all short-term moving averages, with MA5 at 70527, MA10 at 72741, and MA30 at 76953, with prices far below these moving averages. The MACD bar is -1034.69, DIF and DEA are crossing downwards, and the RSI is only 15.62, in a severely oversold area. This indicates an extremely weak daily trend, with bears dominating.
On the 4-hour level, MA5 is at 67550, MA10 is at 69295, and MA30 is at 72172, with prices also below all moving averages. The MACD bar is -544.62, DIF and DEA are crossing, and the RSI is only 10.00, entering extreme oversold territory. The bearish momentum on the 4-hour chart remains strong, but the RSI being oversold suggests that a short-term rebound correction may be needed.
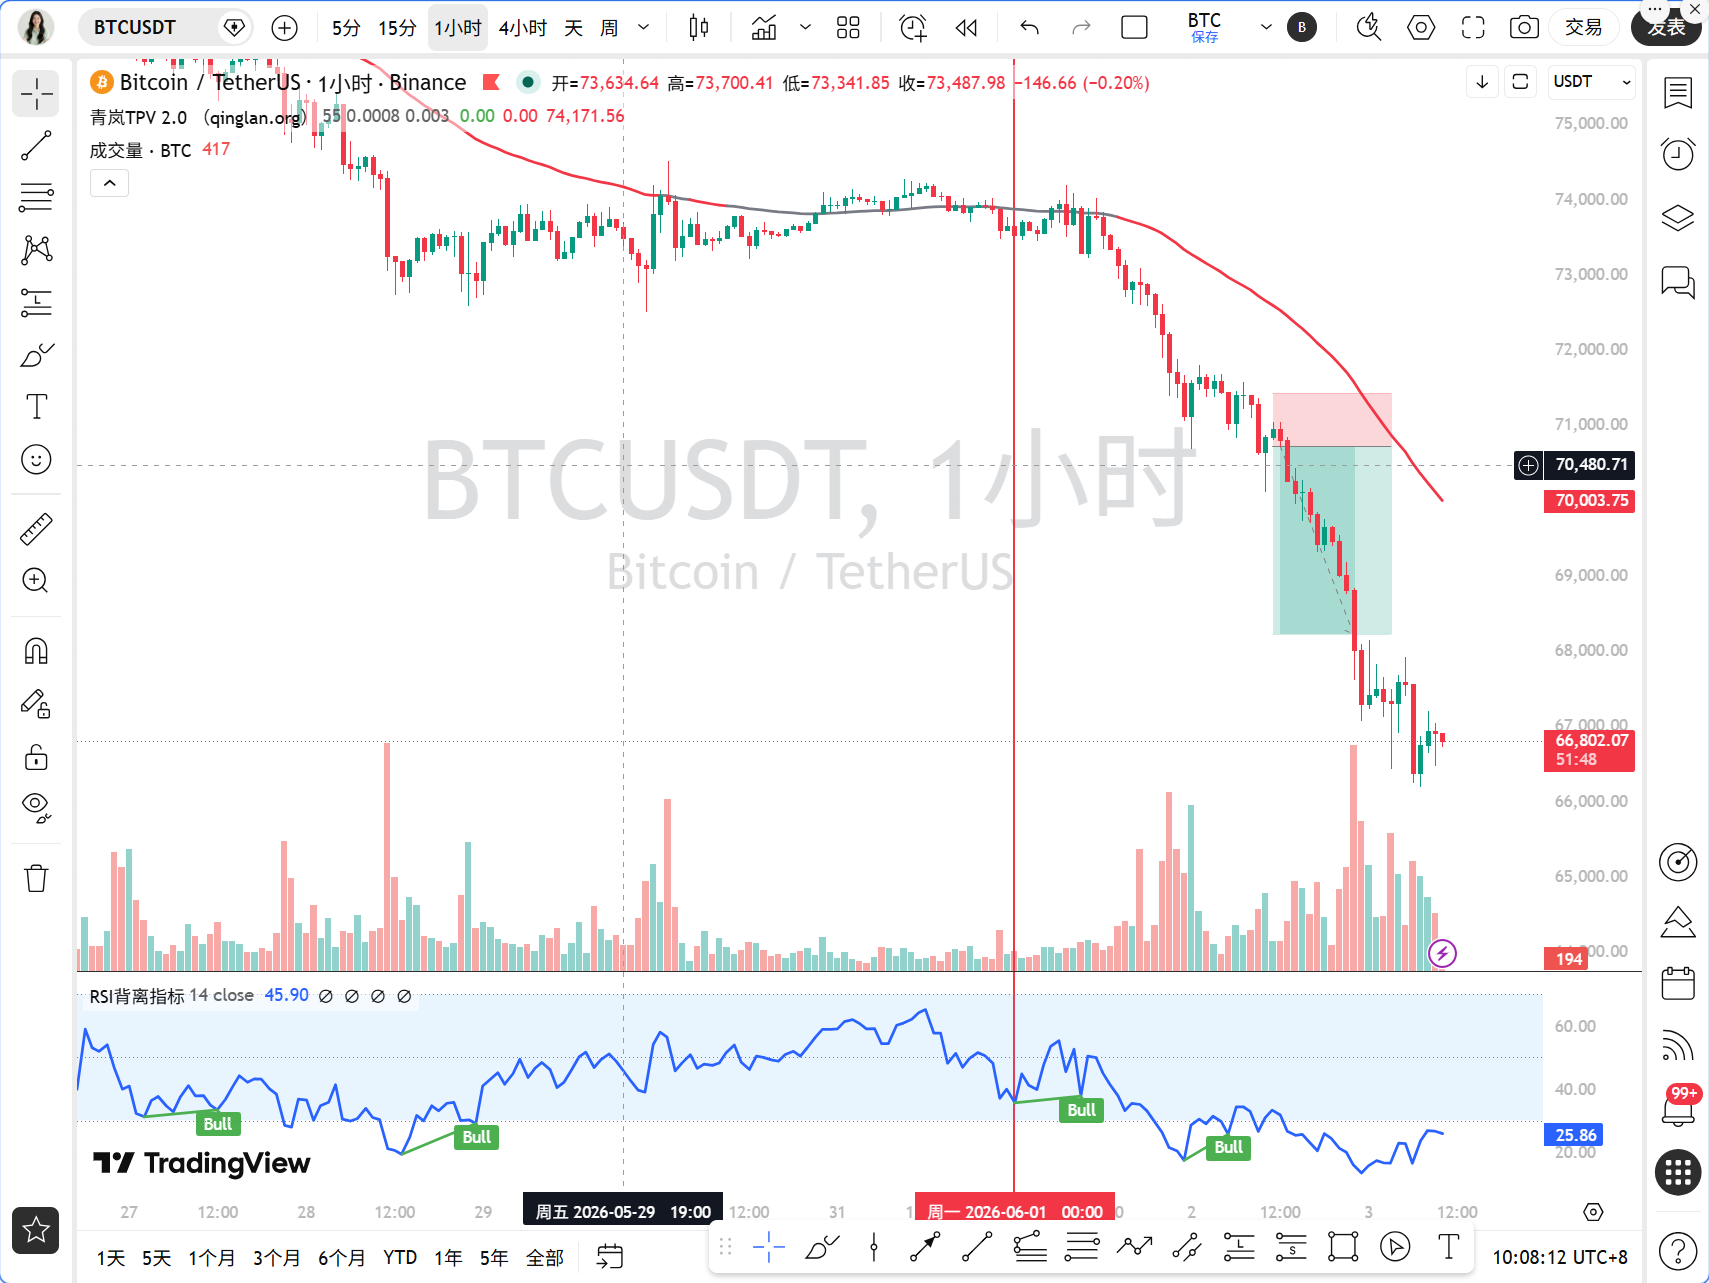
On the 1-hour level, MA5 is at 66782, MA10 is at 67121, and MA30 is at 68967, with prices oscillating between MA5 and MA10. The MACD bar is 29.60, with DIF and DEA just forming a golden cross, and the RSI is 24.56, still in the oversold area. A golden cross signal appears on the 1-hour chart, but the RSI is low, indicating that the rebound strength may be limited.
On the 15-minute level, MA5 is at 66837, MA10 is at 66862, and MA30 is at 67051, with prices fluctuating narrowly around the short-term moving averages. The MACD bar is 40.91, DIF and DEA are crossing upwards below the zero axis, and the RSI is 59.28, in a neutral strong area. The 15-minute chart shows short-term rebound momentum, but is constrained by resistance from the upper moving averages.
TPV signal verification
According to the Qinglan TPV system, we use the 1-hour EMA55 as the boundary between long and short; currently, the EMA55 is 70017.21, with the price of 66910 far below this, in the bearish trend area.
Short selling conditions verification: First, the price is pressured below the 1-hour EMA55, with the closing price of the last 8 hourly candlesticks all below the EMA55, satisfying the condition. Second, there is resistance at the pressure level, with prices in the 67000-67500 range showing long upper shadows multiple times, indicating heavy selling pressure above. Third, the rebound is weak; although a golden cross appears on the 1-hour MACD, the bar value is only 29.60 and the RSI is just 24.56, showing very weak rebound momentum. All three conditions are met, confirming a bearish trend by the TPV system.
Handling of oscillating market: In the past 8 hourly candlesticks, the number of closing prices greater than the EMA55 is 0, and crossing counts are 0, with the price distance to EMA55 at 4.44%, far exceeding the 0.3% threshold, not meeting oscillation conditions, and currently in a clear unilateral bearish trend.
On-chain funding situation
On-chain data shows a fear and greed index of 23, indicating extreme fear; historically, such extreme emotions are often accompanied by a short-term bottom or accelerated decline. BTC's 24-hour drop of 6.51% has led to $1.7 billion in long positions being liquidated, with whale Garrett Jin's long position floating losses of $11.5 million, and Hyperliquid ETH longs facing losses of $47 million, with liquidation risks approaching. In terms of institutional selling, Strategy has sold BTC for the first time in three years, and Abraxas Capital has sold 1000 BTC; this selling pressure directly suppresses the price. However, Greyscale's launch of the HYPE staking ETF may introduce incremental funds through traditional financial products, but the short-term impact is limited.
Key attack and defense positions
The first upper resistance level is at the 1-hour EMA55 of 70017, a lifeline for the bearish trend; if the price rebounds to this level, it will be a critical defensive position for bears. The second resistance level is at 4-hour MA5 of 67550, which is resistance to short-term rebounds. The first lower support level is at the psychological level of 66000, a previous low point, and if it breaks, it may accelerate to 65000 or even 64000. The second support level is at 64000, which is a key support on the daily chart.
Trading thoughts
The current bearish trend is clear, but the RSI is oversold on multiple periods, suggesting a short-term rebound demand. The trading strategy is mainly to short the bounce, not to chase shorts.
Direction: Short
Entry conditions: Wait for the price to rebound to the 67000-67500 range, showing a long upper shadow or an engulfing pattern on the 1-hour level, while the MACD bar begins to shorten; confirm that the rebound momentum is weak before entering.
Stop-loss level: Set above 68000; if the price breaks through this level, the short logic may become invalid.
Target levels: First target 66000, second target 65000, and if it breaks 66000, you can continue to hold until 64000.
If the price directly breaks below 66000, it is not recommended to chase shorts; wait for confirmation of a rebound before re-entering.
Risk warning
Geopolitical conflicts and institutional selling may trigger extreme market conditions, so set stop losses strictly and control positions.
Pay attention to Qinglan Crypto Classroom, let’s seize more trading opportunities together! Welcome to visit the official website www.qinglan.org
📊 Qinglan TPV trading strategy backtesting reference
🕒 Last backtest time 06-03 07:00:02
Total analysis: 1981 Backtests: 1636 Accuracy rate: 67.6% (1106/1636)
免责声明:本文章仅代表作者个人观点,不代表本平台的立场和观点。本文章仅供信息分享,不构成对任何人的任何投资建议。用户与作者之间的任何争议,与本平台无关。如网页中刊载的文章或图片涉及侵权,请提供相关的权利证明和身份证明发送邮件到support@aicoin.com,本平台相关工作人员将会进行核查。