Academician in the Cryptocurrency Circle: Ethereum daily line breaking at 6.3 hides deep downward space, is the turning point clear? Latest market analysis and trading recommendations
Ethereum's current price is 1911, many friends in the cryptocurrency community privately complain to me that Ethereum is hard to trade, panicking to cut losses with a slight drop, and rushing to chase long positions with a slight rebound, continuously being harvested by the market. Now, both the daily and four-hour charts show a downward structure, and short-term sporadic small rebounds cannot change the overall downward trend. Remember not to be misled by small bullish candles and blindly go long; if you don’t understand the market, it’s better to remain out of the market and observe rather than forcing a position and betting on the direction. Trading is about a steady stream, gradually refining the rhythm; steady and accurate strategies are key to establishing a long-term presence in the market.
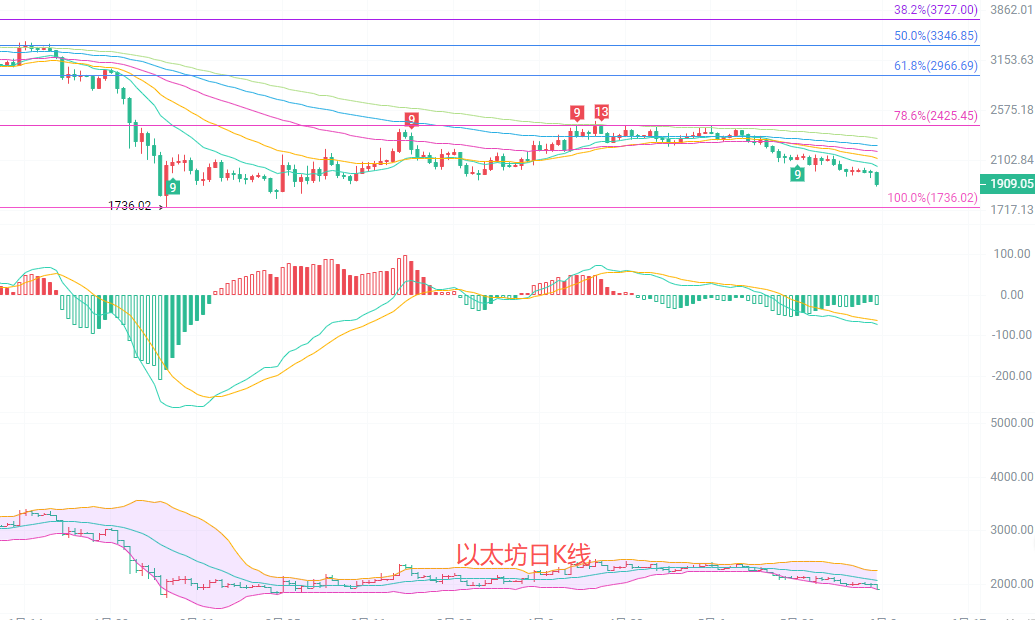
The daily K-line shows a drop of 4.69%, with prices breaking below all EMA moving average systems, and the 30/60/90/120 period moving averages simultaneously turning downwards, forming layered pressure. The Bollinger Bands are opening downwards, and the current price is running near the lower Bollinger Band at 1921, with continuous penetration of lower support. The MACD indicators DIF and DEA continue to move downward below the zero axis, with green bars increasing, and downward momentum is still being released. The overall trend at the daily level is bearish, with key pressure concentrated at the EMA30 moving average position of 2121, making it difficult for a quick reversal to the upside; the market is highly likely to continue a weak volatility downward pattern.
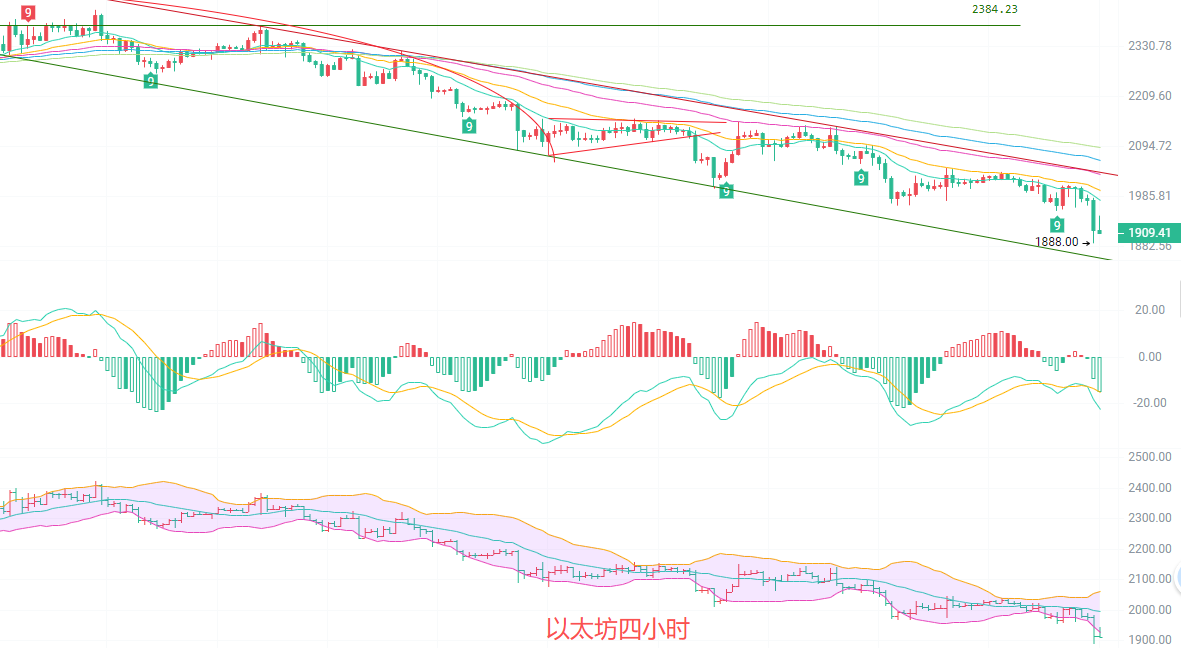
The four-hour K-line is running steadily below all short-term EMA moving averages, with the 15, 30, and 60 period moving averages arranged downwards, forming a pattern of consistent pressure. The Bollinger Bands are opening downwards, and the price is near the lower Bollinger Band at about 1929, with short-term support precarious. The MACD indicator is below the zero axis, with DIF and DEA slightly curving; though green bars are slightly contracting, there is no golden cross signal that indicates a stop in the decline. Although there are minor signs of a stop in decline in the short term, the rebound strength is extremely weak, with the first short-term pressure above at the mid-band level of 2060; any rebound reaching the moving average area will be a downward pressure node, and the short-term trend is unlikely to change its weak tone.
Short-term reference:
Downward from 1950 to 2000, stop loss at 2030, target aiming for 1890 to 1840
Upward from 1880 to 1840, stop loss at 1800, target aiming for 1900 to 1950
Specific operations should be based on real-time market data; for more detailed information, you can consult the author. There might be a delay in the article release; the suggestions are for reference only, and risks are borne by the reader.


Friendly reminder: The above content is created solely by the author on the public account and Weibo; the advertisements at the end of the article and in the comments section are unrelated to the author. Please be cautious in discerning this, thank you for reading.
免责声明:本文章仅代表作者个人观点,不代表本平台的立场和观点。本文章仅供信息分享,不构成对任何人的任何投资建议。用户与作者之间的任何争议,与本平台无关。如网页中刊载的文章或图片涉及侵权,请提供相关的权利证明和身份证明发送邮件到support@aicoin.com,本平台相关工作人员将会进行核查。