Cryptocurrency Expert: Who Will Laugh Last Between Bulls and Bears at 6.2 Ethereum? Latest Market Analysis and Trading Suggestions
Current price of Ethereum is 2004, it rose from 1960 yesterday to now. This type of fluctuating market with short-term back and forth movements shows that compared to Bitcoin, Ethereum has a more stable support. Bitcoin is at 73000, while Ethereum is at 2000. Now Bitcoin is at 71000, and Ethereum remains at 2000, indicating that this position is densely packed like last year. However, before the trend reverses, it’s really not wise to be overly optimistic. Yesterday's near pursuit of a long position but being pushed down is a good example.
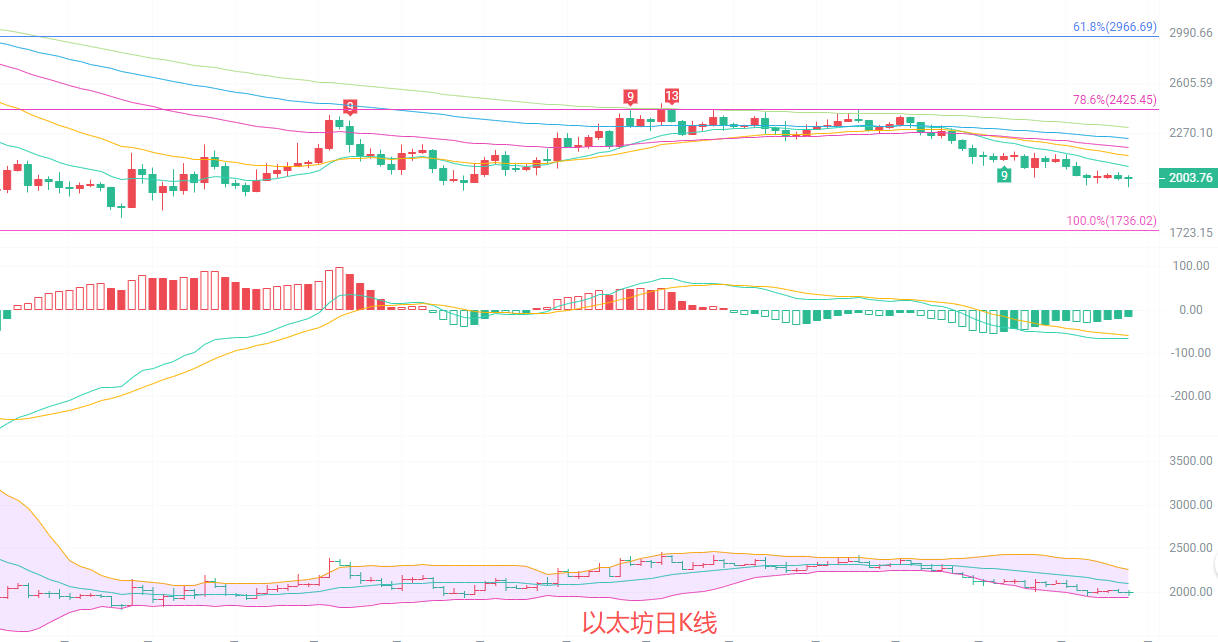
The daily candlestick chart shows a slight decline of 0.10%, and the overall movement remains within a downward channel. Prices have dropped below the EMA15, EMA30, and other short-term moving averages, which are arranged southward, indicating significant pressure above. The MACD indicator shows both the DIF and DEA operating below the zero axis. Although downward momentum is waning, no clear signal for a reversal upwards has yet emerged. The Bollinger Bands are continuously narrowing, with prices running below the middle band, where support exists around the lower band at 1944. The overall trend is weak, and there are currently no strong signs of a reversal.
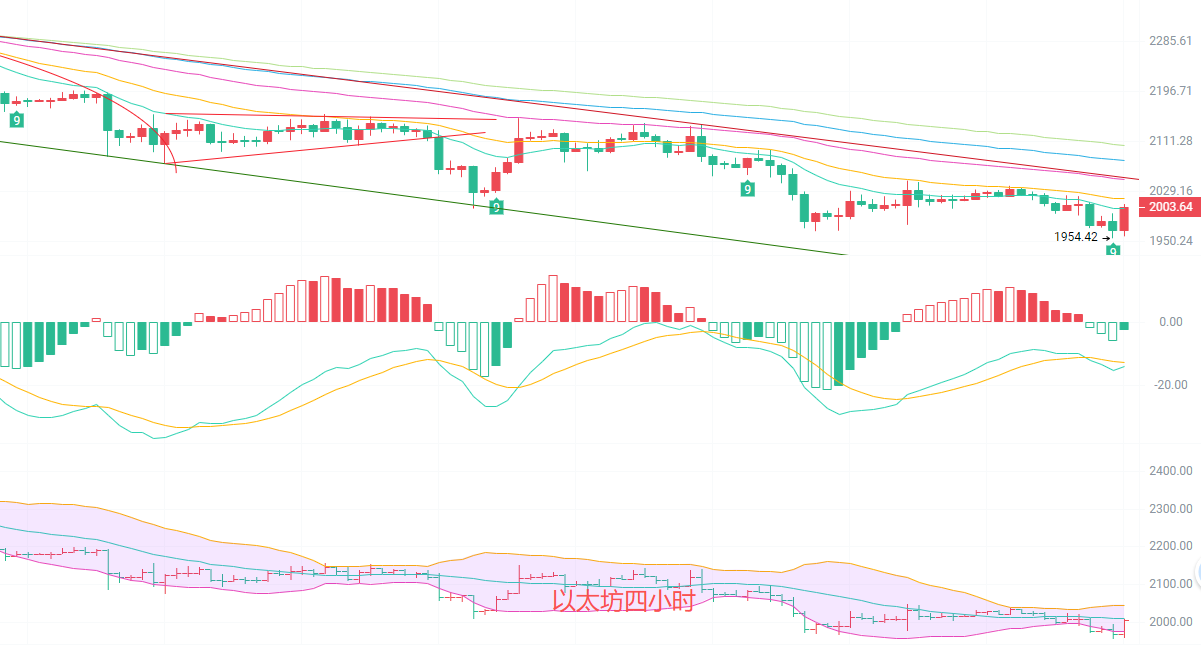
The four-hour candlestick chart shows a slight rebound after touching the low point of 1954, with the current price around 2004. Short-term moving averages are still arranged southward, but the price has climbed above the EMA15, indicating slight stabilization. The MACD indicator is gold-crossed below the zero axis, with red momentum bars continuously expanding. There is a short-term recovery in the upward force. Regarding the Bollinger Bands, prices have rebounded from the lower band towards the middle band, with resistance around the middle band at 2045, and strong pressure at the upper band of 2106. The current rebound is more a correction after a drop, and has not yet broken through the key resistance, remaining within a weak fluctuation range.
Short-term reference:
Selling down from 2070 to 2100, stop loss at 2120, target looking at 2040 to 2010.
Buying up from 1990 to 1960, stop loss at 1930, target looking at 2030 to 2070.
Specific operations should be based on real-time market data. For more detailed information, please consult the author. The article may have a delay in release; suggestions are for reference only, and risks are borne by the reader.


Warm Reminder: The above content is solely created by the author on WeChat public account and Weibo. Ads in the article’s footer and comment section are unrelated to the author, please discern carefully, and thank you for reading.
免责声明:本文章仅代表作者个人观点,不代表本平台的立场和观点。本文章仅供信息分享,不构成对任何人的任何投资建议。用户与作者之间的任何争议,与本平台无关。如网页中刊载的文章或图片涉及侵权,请提供相关的权利证明和身份证明发送邮件到support@aicoin.com,本平台相关工作人员将会进行核查。