Coin Waves: 6.2 Ethereum (ETH) Market Analysis Reference:
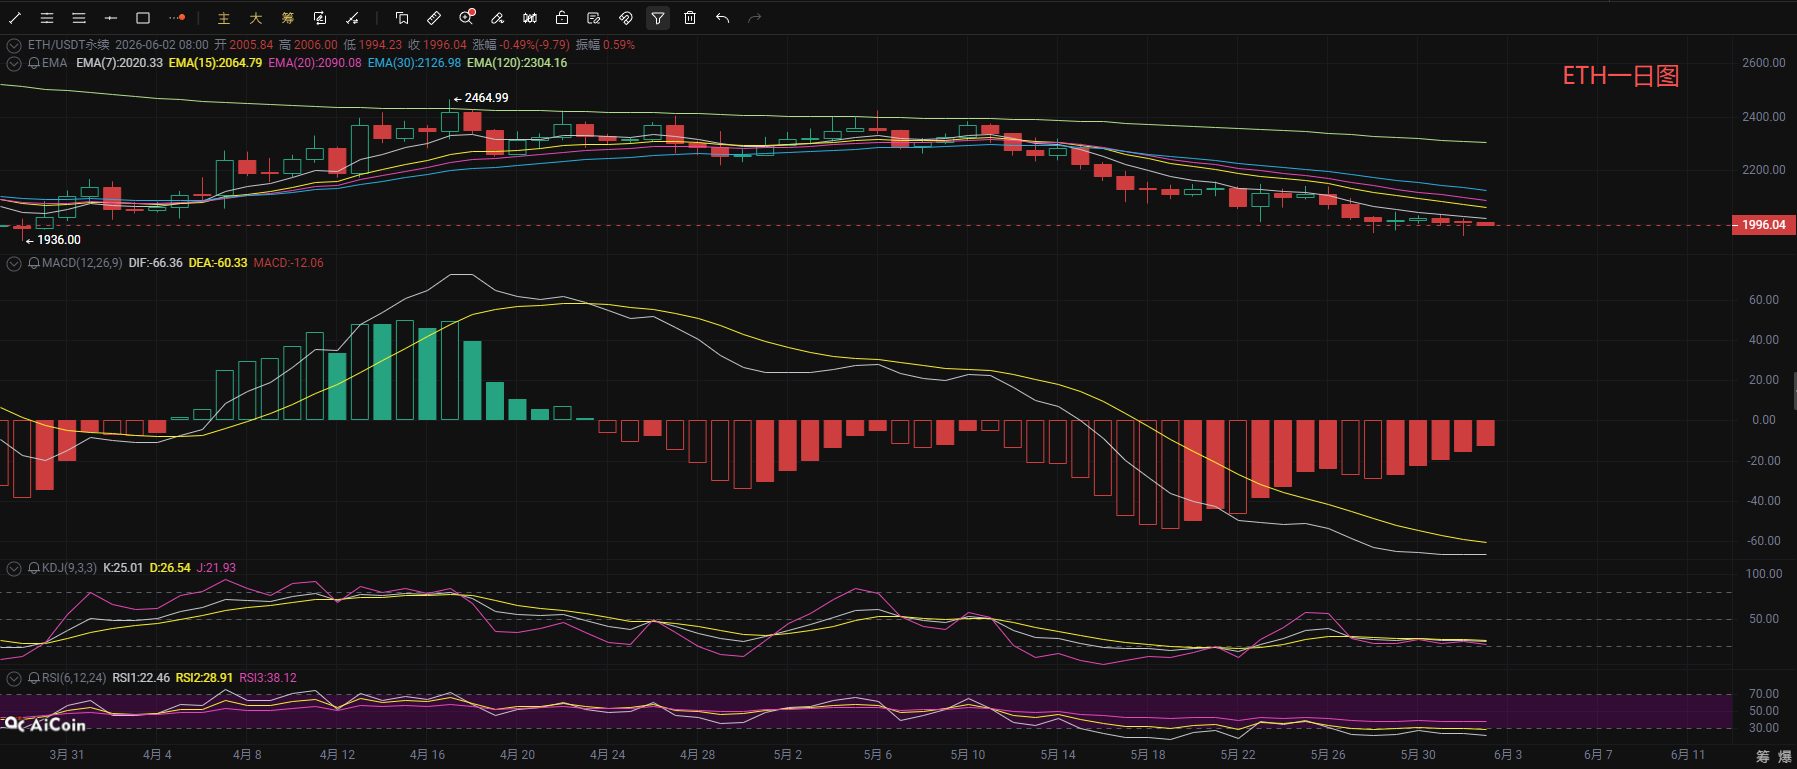
Ethereum's intraday market has shown a rebound correction, still within a downward channel at the daily level. The Bollinger Bands are opening downwards, and the medium-term large structure remains bearish; after the price moved away from the lowest point, it has slightly stabilized with a small upward adjustment, temporarily holding above the lower support of the Bollinger Bands. The moving average system is entirely in a bearish arrangement, with the 7/15/20/30/120-day moving averages sequentially suppressing the price from above. In terms of indicators: the MACD has been in the bearish zone below the zero axis for a long time, with DIF and DEA still located beneath the zero axis. Recently, the histogram has slightly diminished, being merely a recovery from overselling following a decline, not a trend reversal; the KDJ is in the low range of 24~27; the three lines of RSI are around 38, having left the oversold area, indicating a technical rebound demand in the short term, but the daily moving averages and the middle Bollinger Band constitute strong resistance. It is highly probable that there will be a slight rebound to test the upper resistance levels first. If unable to break through with volume, the downward trend will likely continue, and it may retest the critical support below at the 1955 low.
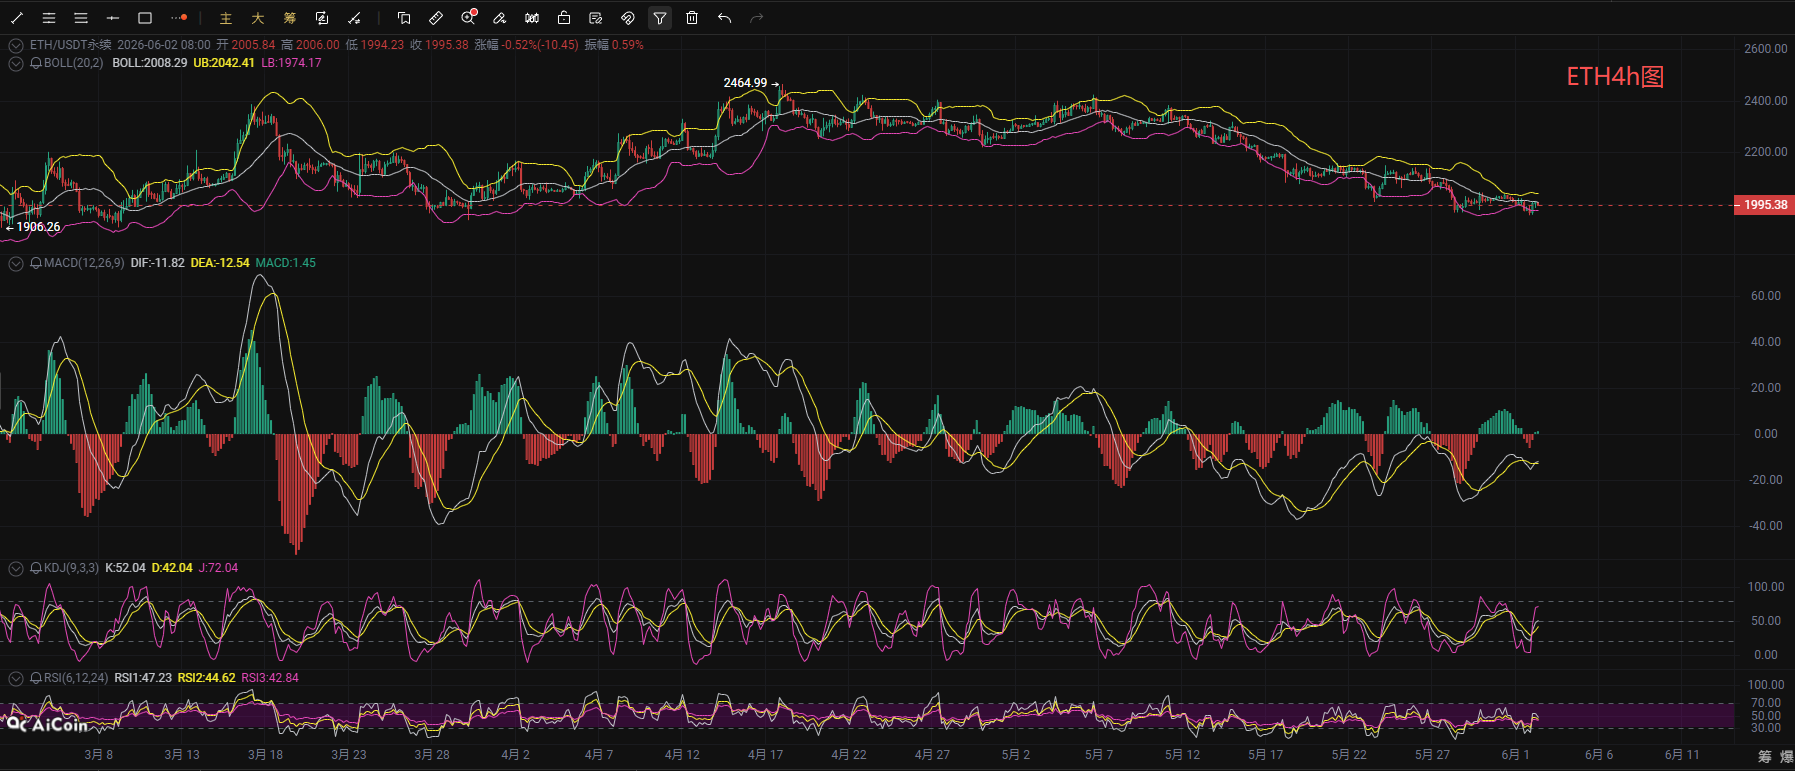
In the short-term 4-hour level, after probing the bottom at 1955, the price has exhibited a low-level oscillation rebound, currently at 1996, located below the middle Bollinger Band. The Bollinger Bands are narrowing and flattening into a range oscillation structure, while the short-term EMA short-cycle moving averages have turned upwards, forming short-term support. On the indicator front, the MACD has turned upwards near the zero axis from below, with the histogram slightly continuing; DIF has crossed above DEA forming a golden cross; the three lines of KDJ are operating upwards in the neutral bullish zone of 47-70, and RSI has rebounded from the low, indicating a slight release of bullish momentum in the short term. The short-term 4-hour maintenance shows an oscillatory upward trend, with 2040-2060 as the initial upper pressure target. If unable to break through with volume above the Bollinger upper band at 2043, it will again retrace to test the support at the Bollinger lower band of 1975. Only by breaking above 2060 with volume can the rebound space be further opened.
Coin Waves: 6.2 Ethereum Short-Term Reference:
Short Position: Sell in the range of 2080-2040, stop loss 30 points, target aim for 2020-1970,
Long Position: Buy in the range of 1940-1970, stop loss 30 points, target aim for 2000-2040,
【The above analysis and strategies are for reference only. Please bear the risks yourself. The publication of this article may be delayed, and the strategies might lack timeliness. Do not operate blindly.】

The content of this article is originally shared by 【Coin Waves】 and represents personal opinion only. There may be delays in sending the article. For reference only, do not operate blindly! Want to get more daily real-time trading signals? Then follow my official account! Here, you can learn online market techniques and understand the knowledge related to exiting positions. I have many years of research experience in the market, focusing on the major trends in the currency circle. Mainly responsible for the analysis and guidance of investment operations in BTC, ETH, SOL, BCH, and other currencies. Welcome to study and research together.
免责声明:本文章仅代表作者个人观点,不代表本平台的立场和观点。本文章仅供信息分享,不构成对任何人的任何投资建议。用户与作者之间的任何争议,与本平台无关。如网页中刊载的文章或图片涉及侵权,请提供相关的权利证明和身份证明发送邮件到support@aicoin.com,本平台相关工作人员将会进行核查。