The close of XRP's May monthly candle has officially shattered investor optimism, unlocking a classic bearish setup just as summer begins. The technical compression of Bollinger Bands on XRP's higher time frames from TradingView, combined with on-chain data, indicates that in the coming weeks the token's price risks falling below the psychological threshold of $1.
The main trigger behind the worsening outlook was XRP closing below the middle line of the Bollinger Bands on the monthly chart, which now acts as resistance at $2.0710. According to the rules of the indicator, the longer the price stays below this level, the more open the path becomes toward a test of the lower band, which is located at $0.9671.
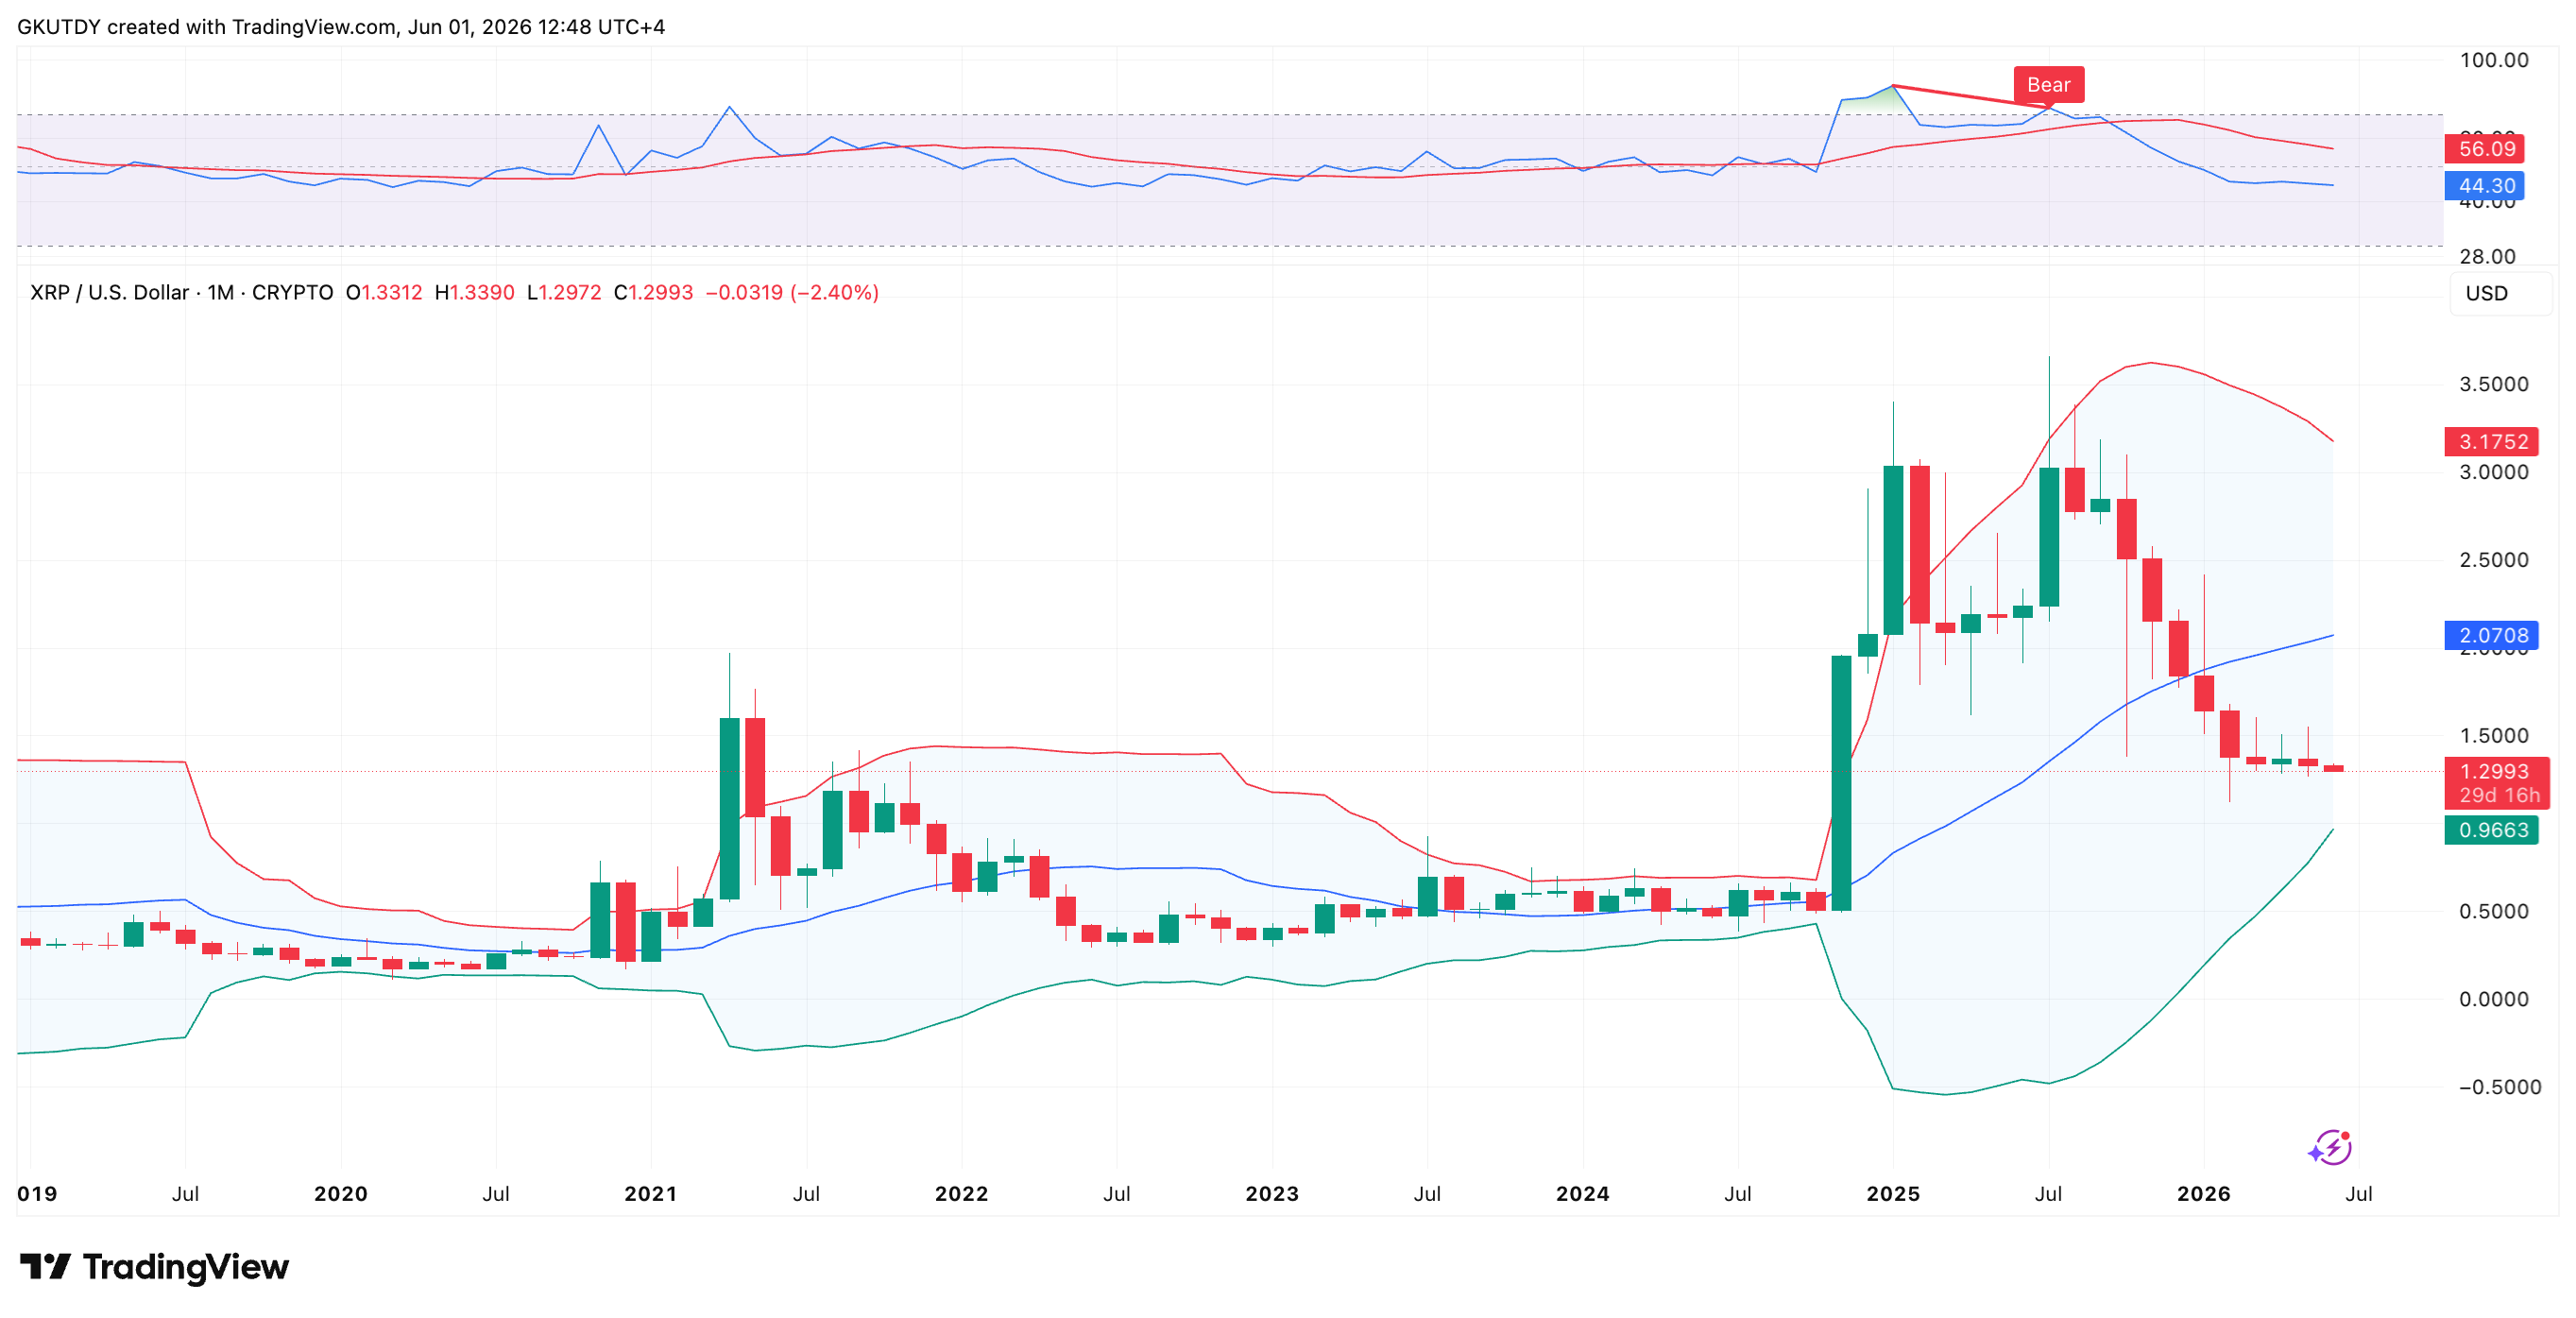
XRP monthly chart with Bollinger Bands, Source: TradingView
The situation is worsened by the relative strength index (RSI). It fell to 44.36 and confirmed a bearish divergence, which points to clear weakness among buyers.
HOT Stories Ripple Releases 1 Billion XRP, How Many Are Left? Another Shiba Inu (SHIB) Recovery Attempt, Bitcoin (BTC) Reaches 'Oversold' State, First Near Protocol (NEAR) Support Activation: Crypto Market Review
The weekly time frame only confirms this negative trend as the three-month spring consolidation ended with quotes breaking downward toward $1.3033. The price is now literally pressing against the lower Bollinger Band at $1.1810 on the weekly chart. In technical analysis, this kind of pressure after a long period of calm usually signals the start of a strong impulsive decline.
Inside the massive XRP retail capitulation
The current breakdown was reinforced by panic within the network itself. Santiment analysts recorded a rapid liquidity cycle at the end of May, as an inflow of 22.8 million XRP was quickly replaced by an outflow of 25.24 million XRP.
Market participants were massively getting rid of assets at the lowest prices in the last 15 weeks, which caused XRP's average cost basis to collapse to the lows of December 2020. As a result, the average active player recorded about a 47% net loss over the past month.
Historical seasonality also points to a difficult period, as June has traditionally been a negative month for XRP, with an average decline of 4.87% and a median drop of 8.20%.
You Might Also Like
Mon, 06/01/2026 - 07:43 BNB Pulls Well Ahead of XRP Market CapByAlex Dovbnya
However, the statistics also indicate a high probability of strong volatility during the summer, since historically depressed June often gives way to a powerful green July with an average gain of 10.2%, after which the market freezes again in a flat range in August.
The only foothold for bulls right now is the extreme level of fear, where a local bottom often forms. If large capital decides to buy up the volumes of panicking retail investors, XRP may still show a technical rebound toward $1.37 and $1.40.
Otherwise, Bollinger Bands will continue dragging price toward the final medium-term target at $0.9671.
免责声明:本文章仅代表作者个人观点,不代表本平台的立场和观点。本文章仅供信息分享,不构成对任何人的任何投资建议。用户与作者之间的任何争议,与本平台无关。如网页中刊载的文章或图片涉及侵权,请提供相关的权利证明和身份证明发送邮件到support@aicoin.com,本平台相关工作人员将会进行核查。


