Academician of the Coin Circle: The downward trend of Ethereum on the daily chart as of May 30 is difficult to reverse. How to grasp short-term opportunities in the 4-hour chart? Latest market analysis and operational suggestions.
In fact, you really don't need to be too anxious about trading; there are opportunities in the market every day, and it's not necessary to catch every wave of the market. Today's rebound looks good, but the overall trend is still bearish. It's fine to try with a small position; don't put all your assets on the line. If you're unsure, it's better to wait and see; wait for the trend to become clear before taking action. Preserving your capital is the most important thing. I hope everyone can make steady profits and not let the market fluctuations dictate their emotions.
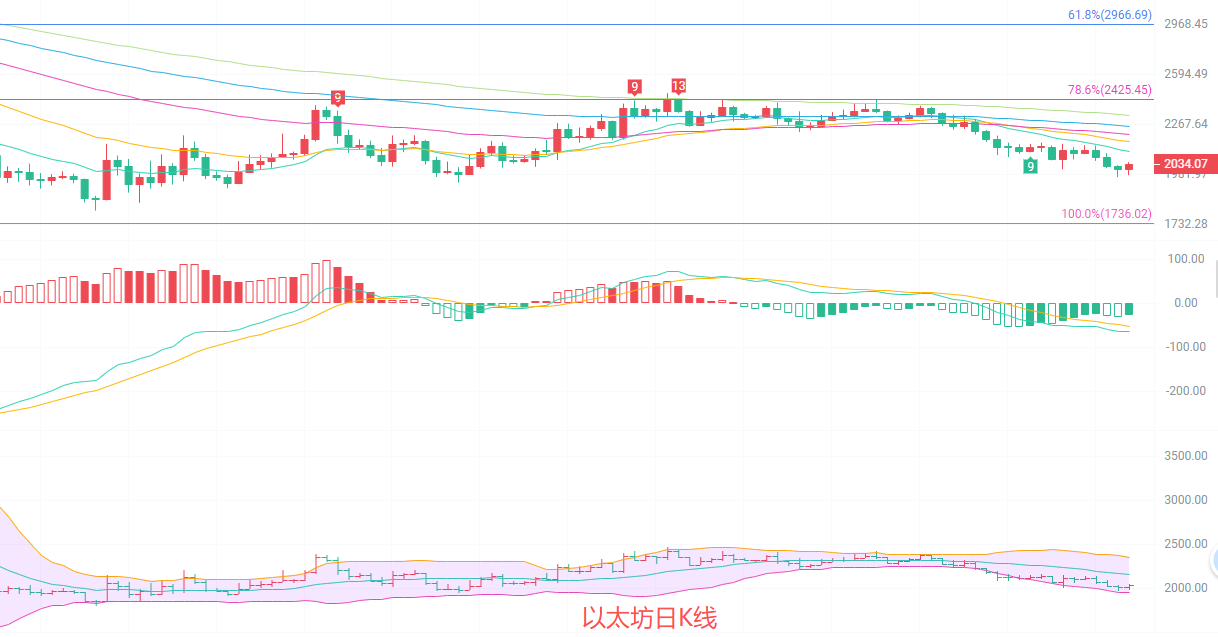
The current price of Ethereum is 2040. The daily candlestick chart is still in a downward channel, with the price pressured below the EMA15/30 moving averages, forming a clear southward arrangement. The MACD indicator shows that the DIF line is below the DEA line, but the green bars are continuously shrinking, indicating that downward momentum is weakening and there is a need for a weak rebound in the short term. The middle line of the Bollinger Bands is continuously moving downwards, the upper resistance level is around 2356, and the lower support level is around 1953. The current price is between the middle line and the lower line, and the weak oscillation pattern remains unchanged. There is no significant increase in trading volume, indicating that both bulls and bears are in a wait-and-see state, with no clear trending signals.
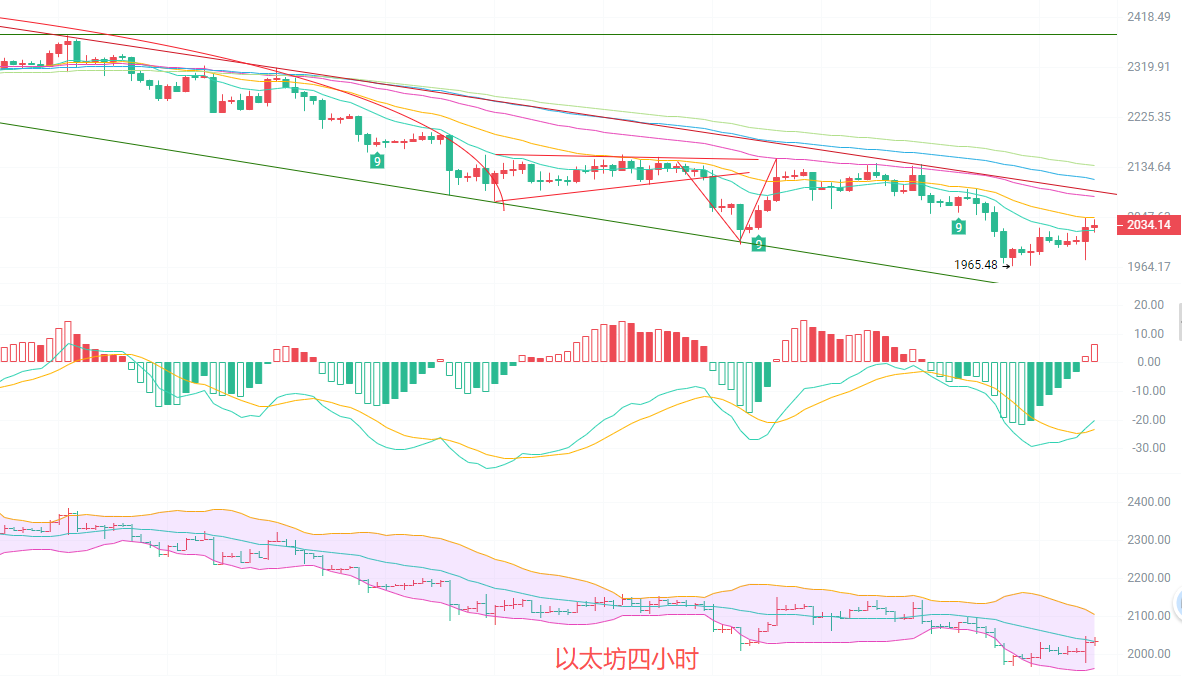
After reaching a low of 1965, the 4-hour candlestick chart showed a slight rebound, and the current price is around 2039. In the short term, it has stood above the EMA15 moving average, but the EMA30/60 moving averages still exert strong pressure. The rebound strength is relatively weak. After the MACD indicator formed a golden cross, the red bars continued to increase in size, and the short-term northward momentum has been released, but overall, it remains below the zero axis, indicating a weak rebound. The Bollinger Bands are opening downward, and the price is moving near the lower line. The upper pressure level is around 2105, and the lower support level is around 1962. The current price has rebounded to near the lower part of the middle line, and the rebound space is limited. Although the short-term moving averages show signs of turning, the long-term moving averages still present a downward arrangement, and the overall trend has not reversed.
Short-term reference:
From 2070 to 2100 downward, stop loss at 2120, target looking at 2040 to 2010.
From 2010 to 1980 upward, stop loss at 1950, target looking at 2050 to 2070.
Specific operations should be based on real-time market data. For more information, please consult the author. There may be delays in article publication; suggestions are for reference only, and risks are borne by the investor.


Warm reminder: The above content is solely created by the author on Weibo. The advertisements at the end of the article and in the comments section are unrelated to the author. Please discern carefully. Thank you for reading.
免责声明:本文章仅代表作者个人观点,不代表本平台的立场和观点。本文章仅供信息分享,不构成对任何人的任何投资建议。用户与作者之间的任何争议,与本平台无关。如网页中刊载的文章或图片涉及侵权,请提供相关的权利证明和身份证明发送邮件到support@aicoin.com,本平台相关工作人员将会进行核查。