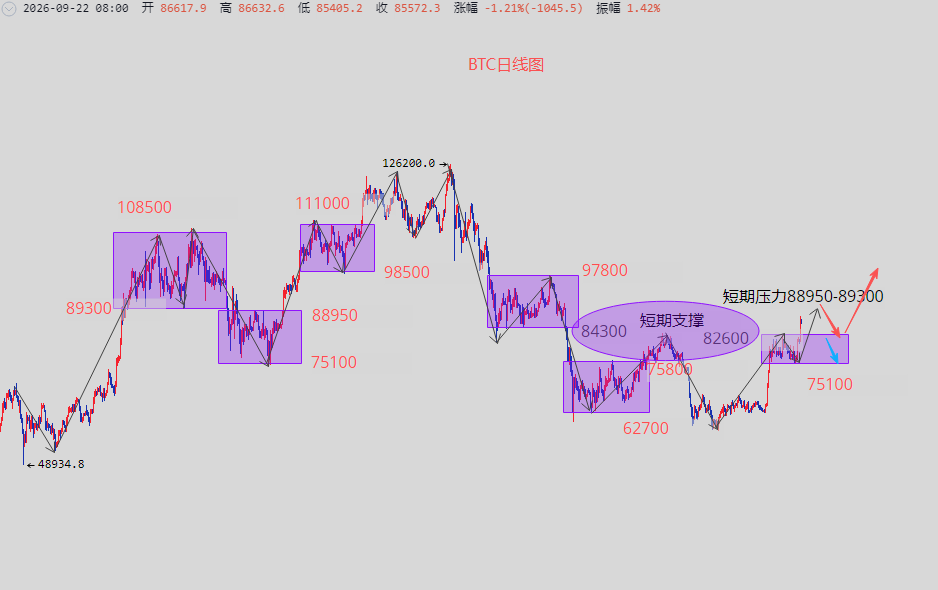
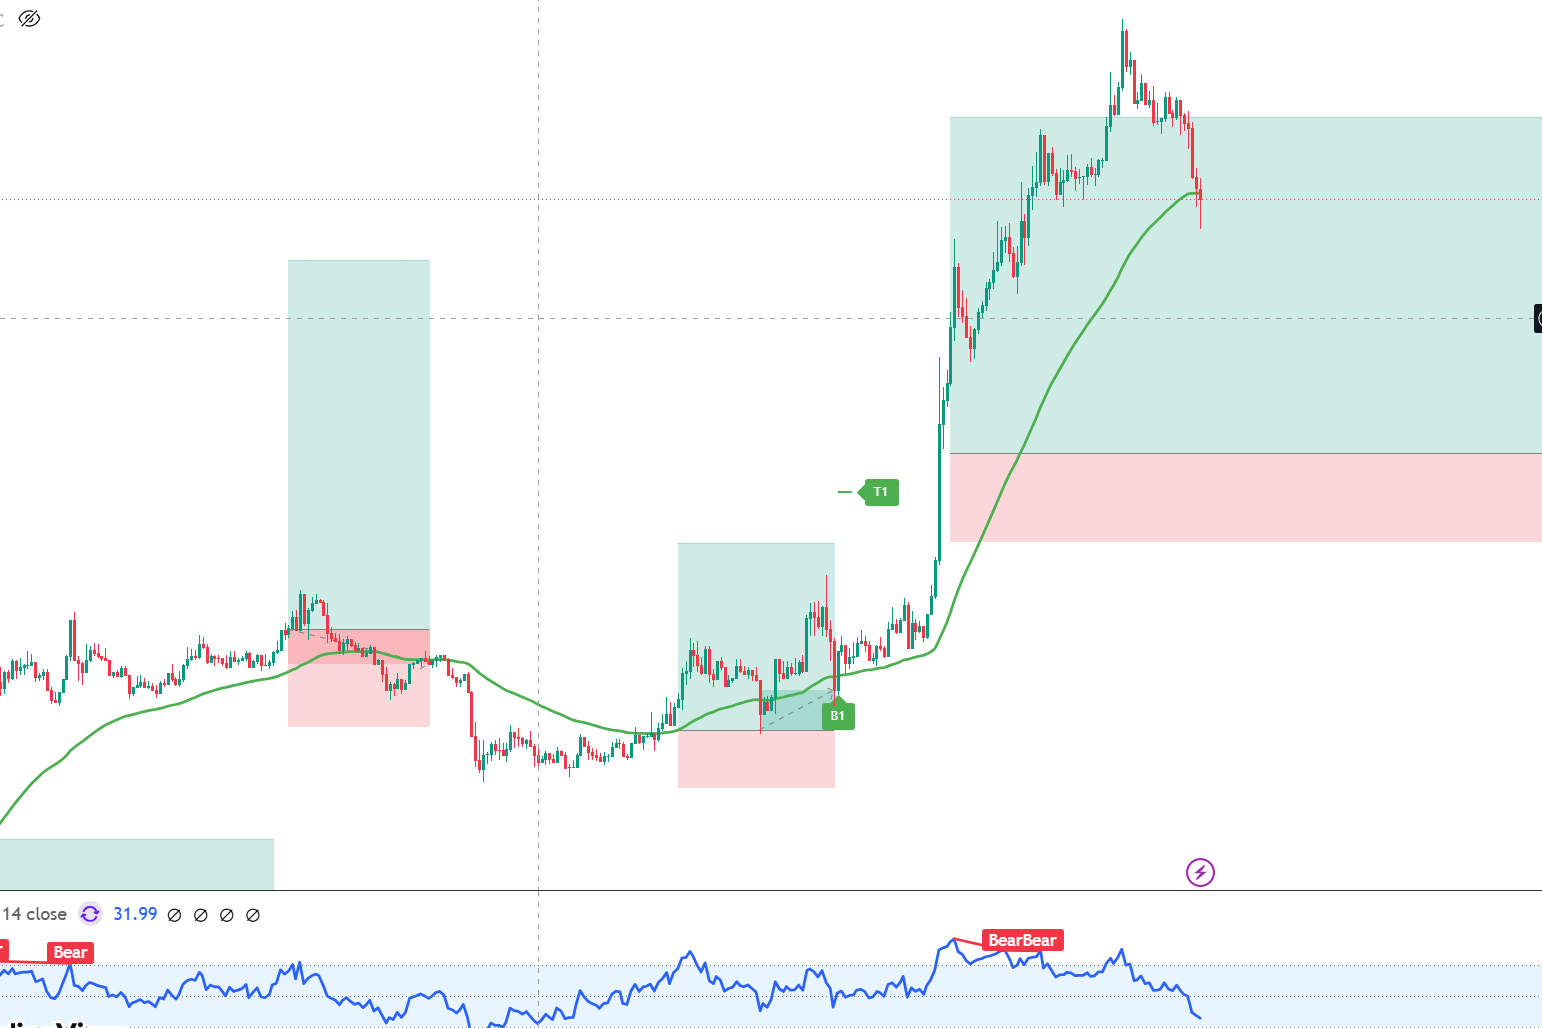
Crypto Circle Academician: As of 5.30, the weakness of Bitcoin's daily level remains unchanged! Can it break through daily resistance? Latest market analysis and trading suggestions
Bitcoin's current price is 73500. The current market situation is a battle of wits on both sides, with speculators wanting to bottom out and the main force wanting to raid your house. So are we bottom fishing or getting raided? The main force cannot push it up, nor can it completely drop; it keeps oscillating and washing out positions, causing many crypto friends to lose their patience. In fact, the hardest part is not judging the direction but controlling your hands. Knowing full well that one should not chase highs and cut losses, do not be led by emotions. Take it slow, don't rush. Protecting the principal is more important than anything.
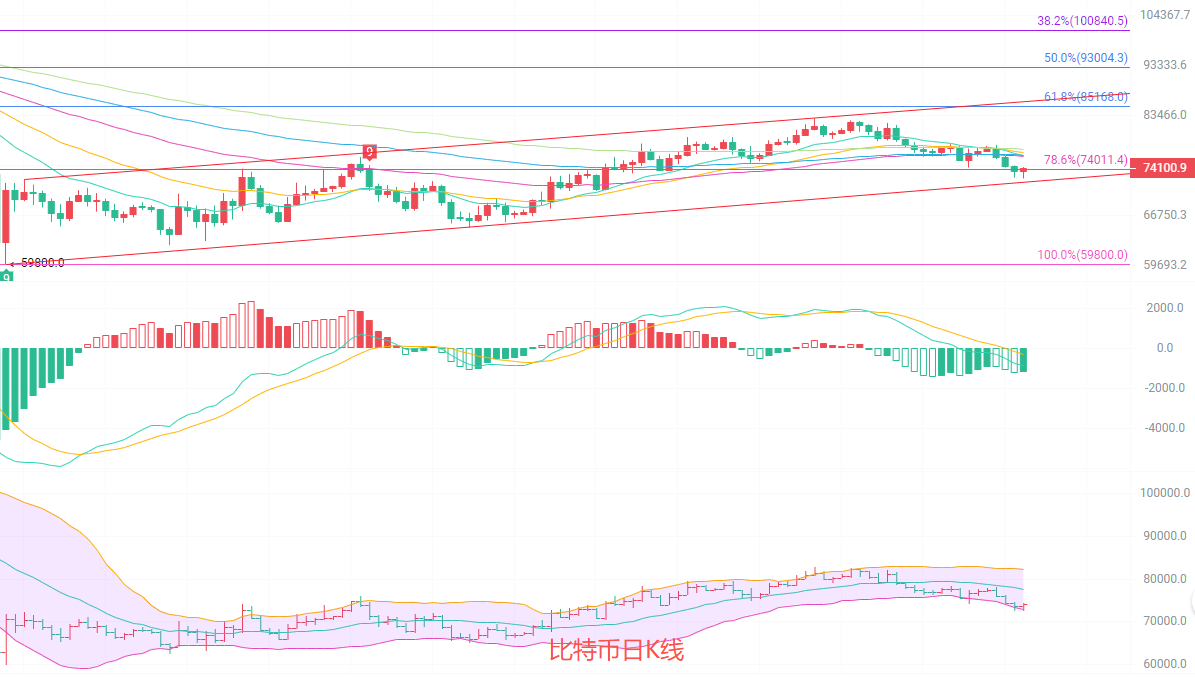
The daily K-line price is still operating below EMA15 and EMA30, with short-term moving averages arranged southward, showing significant resistance. In the MACD indicator, DIF continues to stay below DEA, with green bars slightly shortening but still remaining below the zero axis. Although the southward momentum is diminishing, it has not fully reversed. The Bollinger Bands are converging, with the price running below the middle track, the lower track support around 72950, and upper track resistance at 82330. Overall, the daily level is still in a weak consolidation bottoming phase, with no clear trend reversal signals appearing yet.
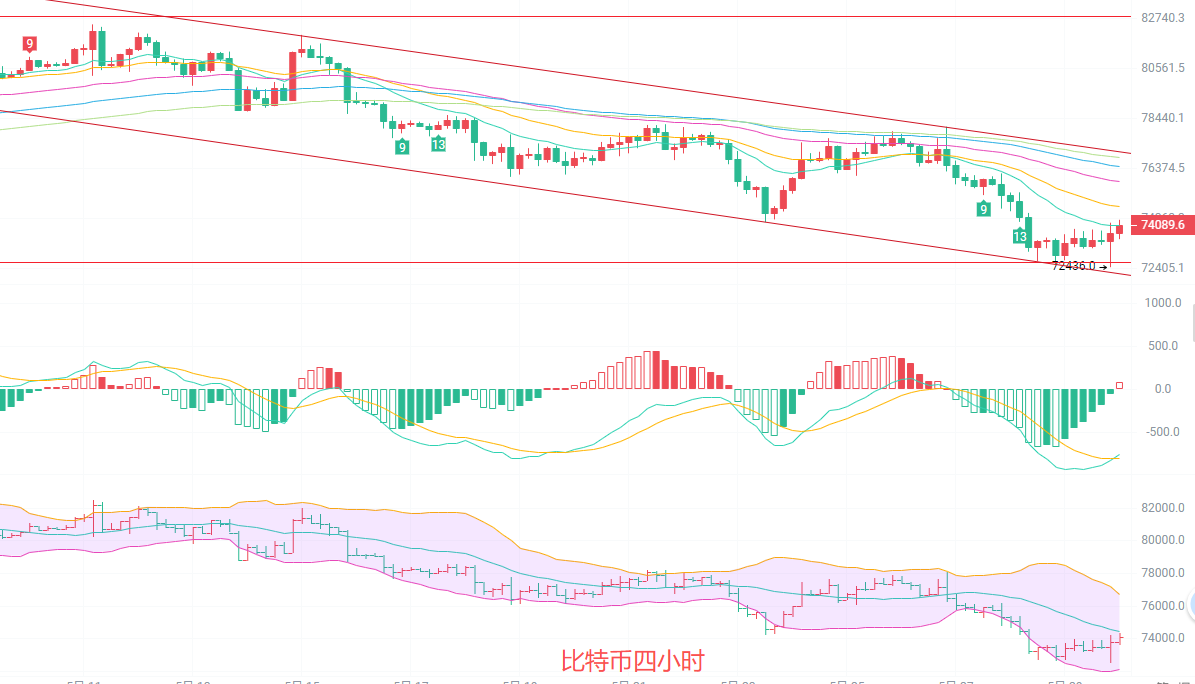
The four-hour K-line shows a slight rebound after hitting a low of 72436, with the current price at 74287 still above EMA15. However, EMA30, EMA60, and other long-term moving averages are still diverging downward, and the short-term rebound has not broken through mid-term resistance. The MACD indicator shows DIF turning upward, approaching DEA, with green bars continuing to shorten, indicating that short-term upward momentum has slightly increased. The Bollinger Bands lower track support is at 72136, and upper track resistance is at 76743, with the price currently running below the middle track; the rebound needs to pay attention to the effectiveness of the pressure near the middle track.
Short-term trading thoughts: Follow the trend of the larger cycle, small stop losses and quick entries and exits
Buy in the range of 73500 to 73000, stop loss at 72500, with a target of 74500 to 75000
Sell in the range of 76000 to 76500, stop loss at 77000, with a target of 75500 to 74500
Specific operations should be based on real-time market data. For more information, please consult the author. The article may have delays in publishing, and the suggestions are for reference only; risks are borne by yourself.

Warm reminder: The above content is solely created by the author for the public account and Weibo. Any advertisements at the end of the article or in the comments section are unrelated to the author. Please discern cautiously, and thank you for reading.
免责声明:本文章仅代表作者个人观点,不代表本平台的立场和观点。本文章仅供信息分享,不构成对任何人的任何投资建议。用户与作者之间的任何争议,与本平台无关。如网页中刊载的文章或图片涉及侵权,请提供相关的权利证明和身份证明发送邮件到support@aicoin.com,本平台相关工作人员将会进行核查。